Traders' Tip text
In this month's Tip space we show how to screen for symbols that meet a specified criteria as of the most recent date. The criteria here is the value of an oscillator like RS4 or RS5: the strongest ranked funds get the preference.
To set things up, first have your index funds (or whatever instruments required) in a Wealth-Lab DataSet and update their data. Then in the screener code, type in your symbol names instead of author's choice of funds:
{"FXAIX", "FNCMX", "FSMDX", "FSSNX", "FSPGX", "FLCOX", "FPADX", "FSRNX", "FSAGX", "FSUTX", "FTBFX"};
By running the screener below on a DataSet of chosen symbols in portfolio backtest mode, you'll get a list of signals to buy on the open in the Alerts view as on Figure 1:
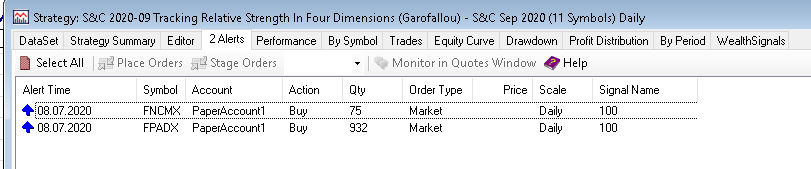 Figure 1. A view of the Alerts tab with 2 signals with the highest reading of the RS5 oscillator.
If you wish to visualize the oscillators, double click on any trading signal. Wealth-Lab will plot them on a chart like Figure 2 illustrates:
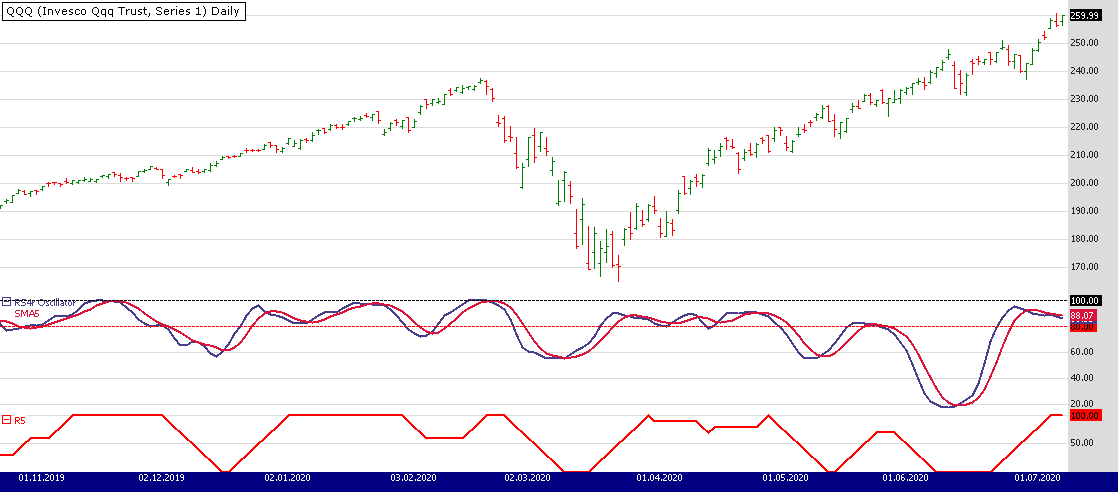 Figure 2. A sample plot of the RS4 and RS5 oscillators built using author’s default set of 11 index funds on the daily chart of QQQ. Index fund data provided by Tiingo.
On a closing note, simply download public strategies from Wealth-Lab (hit Ctrl-O and choose "Download...") to get the trading system code below:
WealthScript Code (C#)
using System;
using System.Collections.Generic;
using System.Text;
using System.Drawing;
using WealthLab;
using WealthLab.Indicators;

namespace WealthLab.Strategies
{
	public class TASC2020_09 : WealthScript
	{
		LineStyle ls = LineStyle.Solid;

		public DataSeries RS2t(DataSeries ds, string index, int period = 10, bool plotSeries = false)
		{
			var rs = new DataSeries(ds, string.Format("RS2t({0},{1},{2}", ds.Description, index, period));
			var extSym = GetExternalSymbol(index, true);
			var RS1 = ds / extSym.Close;

			var Fast = EMAModern.Series(RS1, period);   //Fast MA: Orange
			var Med = SMA.Series(Fast, 7);              //Medium MA: Green
			var Slow = SMA.Series(Fast, 15);            //Slow MA: Red
			var Vslow = SMA.Series(Slow, 30);           //V Slow MA: Blue

			int Tier1 = 0, Tier2 = 0, Tier3 = 0, Tier4 = 0;

			for (int bar = GetTradingLoopStartBar(Math.Max(period * 3, 30)); bar < ds.Count; bar++)
			{
				Tier1 = (Fast[bar] >= Med[bar] && Med[bar] >= Slow[bar] && Slow[bar] >= Vslow[bar]) ? 10 : 0;
				Tier2 = (Fast[bar] >= Med[bar] && Med[bar] >= Slow[bar] && Slow[bar] < Vslow[bar]) ? 9 : 0;
				Tier3 = (Fast[bar] < Med[bar] && Med[bar] >= Slow[bar] && Slow[bar] >= Vslow[bar]) ? 9 : 0;
				Tier4 = (Fast[bar] < Med[bar] && Med[bar] >= Slow[bar] && Slow[bar] < Vslow[bar]) ? 5 : 0;

				rs[bar] = Tier1 + Tier2 + Tier3 + Tier4;
			}

			if (plotSeries)
			{
				var rp = CreatePane(50, false, true);
				PlotSeries(rp, RS1, Color.Black, ls, 1);
				PlotSeries(rp, Fast, Color.DarkOrange, ls, 2);
				PlotSeries(rp, Med, Color.MediumSeaGreen, ls, 2);
				PlotSeries(rp, Slow, Color.Crimson, ls, 2);
				PlotSeries(rp, Vslow, Color.SteelBlue, ls, 2);
			}

			return rs;
		}

		protected override void Execute()
		{
			int period = 10;
			var lstIndices = new List<string>()
			{ "FXAIX", "FNCMX", "FSMDX", "FSSNX", "FSPGX", "FLCOX", "FPADX", "FSRNX", "FSAGX", "FSUTX", "FTBFX"};

			var RS3x = Close * 0;
			foreach (var fund in lstIndices)
			{
				RS3x += RS2t(Close, fund, period);
			}

			var RS4 = (RS3x / lstIndices.Count) * 10;       //Scaled to 0 to 100
			for (int bar = 0; bar < RS4.Count; bar++) RS4[bar] = Math.Round(RS4[bar]);
			var RS4osc = SMA.Series(RS4, 3);                //RS oscillator
			var Mv = SMA.Series(RS4osc, 5);                 //RSosc's signal line

			var rp = CreatePane(40, false, true);
			PlotSeries(rp, RS4osc, Color.DarkSlateBlue, ls, 2, "RS4r Oscillator");
			PlotSeries(rp, Mv, Color.Crimson, ls, 2, "SMA5");
			HideVolume();

			DrawHorzLine(rp, 80, Color.Red, LineStyle.Dashed, 1);
			DrawHorzLine(rp, 100, Color.Black, LineStyle.Dashed, 1);

			var mvRS4 = WMA.Series(RS4, 4);                 //Moving Avg of RS4r
			var R5 = new DataSeries(Close, string.Format("R5({0})",period));
			var x = Open * 0;
			for (int bar = 1; bar < RS4.Count; bar++)
			{
				bool RS4up = (RS4[bar] >= 80 || RS4[bar] > mvRS4[bar]); //RS4r is above signal line
				x[bar] = RS4[bar] >= 80 ? 1 : 0;						//RS4r must be >= 80
			}

			//Avg of >80 scores in period
			for (int bar = 1; bar < RS4.Count; bar++)
				R5[bar] = (Sum.Series(x, period)[bar] / period) * 100;

			var rp5 = CreatePane(20, false, true);
			PlotSeries(rp5, R5, Color.Red, ls, 2, "R5");

			int b = Bars.Count - 1;
			if (b < Math.Max(period * 3, 30)) return;
			//if ( RS4osc[b] > 80 ) BuyAtMarket(b + 1, Math.Round(RS4osc[b]).ToString());
			if ( R5[b] > 80 ) BuyAtMarket(b + 1, Math.Round(R5[b]).ToString());
		}
	}
}
Gene Geren (Eugene)
Wealth-Lab team