Traders' Tip text
The code for Wealth-Lab Version 6 for the suggested zero-lag Triple EMA crossover system is presented. We interpreted the “power of analyzing” logic to exit for a profit when the averages cross, but exit for a loss at the lesser price of a 10% stop loss or a close lower than the lowest low of the 21 bars prior to entry. Running that strategy in Portfolio Simulation mode using 5% of equity per trade on the Nasdaq 100 over the 5 years ending 12/31/2007 resulted in gains of approximately 21% annualized. The actual result varies from simulation to simulation since the portfolio can hold only 20 positions simultaneously using the 5% of equity sizing method. The Buy & Hold strategy, however, returned nearly 38% APR over the same period.
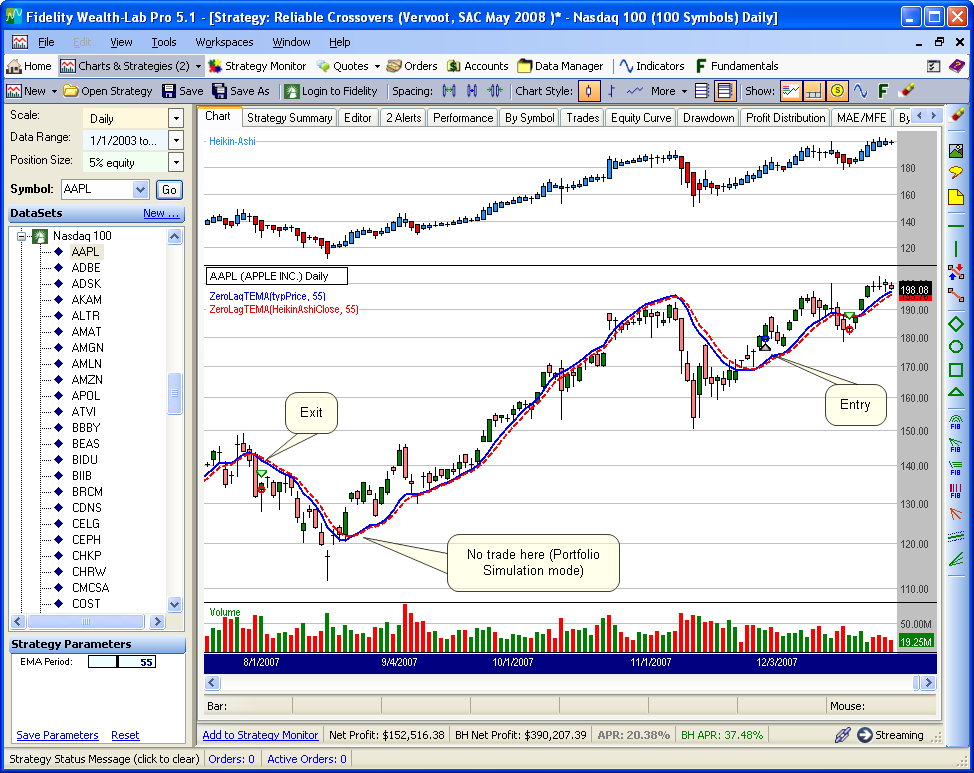 Figure 1.
 Note that one of the crossovers did not result in creating a simulated trade. This is not an error and due to the results of a Portfolio Simulation in which insufficient equity existed at the time of the trading alert. The WealthScript code also creates the Heikin-Ashi chart style.
Strategy Code
using System;
using System.Collections.Generic;
using System.Text;
using System.Drawing;
using WealthLab;
using WealthLab.Indicators;
using TASCIndicators;

namespace WealthLab.Strategies
{
	public class ReliableCrossovers : WealthScript
	{
		// Create slider parameter(s)
		private StrategyParameter emaPeriod;
		public ReliableCrossovers()
		{
			emaPeriod = CreateParameter("EMA Period", 55, 10, 120, 5);
		}

		public DataSeries ZLTEMASeries(DataSeries Source, int Period, EMACalculation calcType)
		{
			DataSeries tma1 = TEMA.Series(Source, Period, calcType);
			DataSeries tma2 = TEMA.Series(tma1, Period, calcType);
			return tma1 + (tma1 - tma2);
		}

		protected override void Execute()
		{
			/* Create a Heikin-Ashi chart above the main PricePane */
			DataSeries HO = Open + 0; // intializations
			DataSeries HH = High + 0;
			DataSeries HL = Low + 0;
			DataSeries HC = (Open + High + Low + Close) / 4;
			DataSeries haC = HC + 0;
			haC.Description = "Heikin-Ashi Close";

			for (int bar = 1; bar < Bars.Count; bar++)
			{
				double o1 = HO[ bar - 1 ];
				double c1 = HC[ bar - 1 ];
				HO[bar] = ( o1 + c1 ) / 2;
				HH[bar] = Math.Max( HO[bar], High[bar] );
				HL[bar] = Math.Min( HO[bar], Low[bar] );
				haC[bar] = ( HC[bar] + HO[bar] + HH[bar] + HL[bar] ) / 4;
			}
			ChartPane haPane = CreatePane(40, true, true);
			PlotSyntheticSymbol(haPane, "Heikin-Ashi", HO, HH, HL, HC, Volume, Color.DodgerBlue, Color.Red);

			//Obtain SMA period from parameter
			int period = emaPeriod.ValueInt;
			double stop = 0d;
			double LL = 0d;
			DataSeries typPrice = ( High + Low + Close ) / 3;

			DataSeries zlTyp = ZLTEMASeries(typPrice, period, EMACalculation.Modern);
			zlTyp.Description = "ZeroLagTEMA(typPrice, " + period + ")";
			PlotSeries(PricePane, zlTyp, Color.Blue, LineStyle.Solid, 2);

			DataSeries zlHa = ZLTEMASeries(haC, period, EMACalculation.Modern);
			zlHa.Description = "ZeroLagTEMA(HeikinAshiClose, " + period + ")";
			PlotSeries(PricePane, zlHa, Color.Red, WealthLab.LineStyle.Dashed, 2);

			for(int bar = period; bar < Bars.Count; bar++)
			{
				if (IsLastPositionActive)
				{
					Position p = LastPosition;
					stop = Math.Min(LL, p.EntryPrice * 0.9);
					if( CrossUnder(bar, zlTyp, zlHa) && Close[bar] > p.EntryPrice )
						SellAtMarket(bar + 1, p, "Profit");
					else if( Close[bar] < stop )
						SellAtMarket(bar + 1, p, "Stop Loss");
				}
				else if( CrossOver(bar, zlTyp, zlHa) )
				{
					LL = Lowest.Series(Low, 21)[bar];
					BuyAtMarket(bar + 1);
				}
			}
		}
	}
}