Traders' Tip text
Wealth-Lab Version 6 code in C# for the PID Oscillator is provided along with Strategy Parameter sliders for manual and programmed optimization. While traders should be conscious of over-optimization, Figure 1 shows that it can be useful to adjust the sensitivities of RSI and/or the moving average periods for particular instruments to obtain more PDO signals. As mentioned in the article, the oscillator can be a good guide for use in an exit strategy - perhaps triggering logic to raise trailing profit stops.
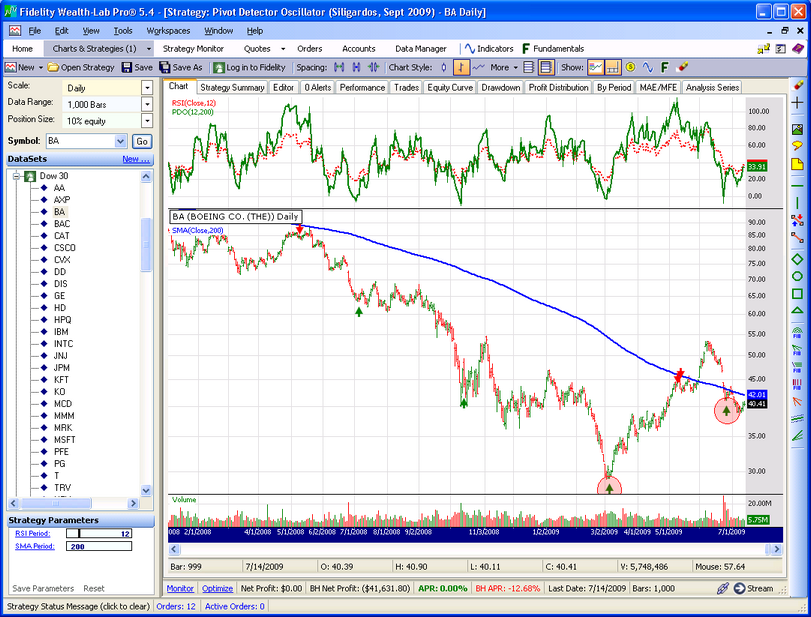 Figure 1.
 The highlighted buy signals for Boeing were triggered for a 12-period, but not a 14-period RSI.
WealthScript Code (C#)
using System;
using System.Collections.Generic;
using System.Text;
using System.Drawing;
using WealthLab;
using WealthLab.Indicators;

namespace WealthLab.Strategies
{
	public class MyStrategy : WealthScript
	{
		StrategyParameter rsiPeriod;
		StrategyParameter smaPeriod;

		public MyStrategy()
		{
			rsiPeriod = CreateParameter("RSI Period", 14, 10, 21, 1);
			smaPeriod = CreateParameter("SMA Period", 200, 50, 200, 10);
		}

		protected override void Execute()
		{
			Font font = new Font( "Wingdings 3", 14, FontStyle.Regular );
			string UpArrow = Convert.ToChar(0x0097).ToString();
			string DnArrow = Convert.ToChar(0x0098).ToString();

			DataSeries rsi = RSI.Series(Close, rsiPeriod.ValueInt);
			DataSeries sma = SMA.Series(Close, smaPeriod.ValueInt);

			// Create and plot the PID Oscillator
			DataSeries pidOsc = new DataSeries(Bars, "PDO(" + rsiPeriod.ValueInt + "," + smaPeriod.ValueInt +  ")");
			for(int bar = smaPeriod.ValueInt; bar < Bars.Count; bar++)
			{
				pidOsc[bar] = Close[bar] > sma[bar] ? (rsi[bar]-35)/(85 - 35) : (rsi[bar]-20)/(70 - 20);
				pidOsc[bar] = 100 * pidOsc[bar];

				// Show the buy/sell advisories
				if( CrossOver(bar, pidOsc, 0) )
					AnnotateBar( UpArrow, bar, false, Color.Green, Color.Transparent, font );
				else if( CrossUnder(bar, pidOsc, 100) )
					AnnotateBar( DnArrow, bar, true, Color.Red, Color.Transparent, font );
			}

			// Plotting
			ChartPane rsiPane = CreatePane(40, true, true);
			PlotSeries(rsiPane, rsi, Color.Red, LineStyle.Dotted, 2);
			PlotSeries(PricePane, sma, Color.Blue, LineStyle.Solid, 2);
			PlotSeries(rsiPane, pidOsc, Color.Green, LineStyle.Solid, 2);
		}
	}
}