Adaptive Lookback period finder: Indicator Documentation
Syntax
public AdaptiveLookback(Bars bars, int howManySwings, bool UseAll, string description)
public AdaptiveLookback(Bars bars, int howManySwings, bool UseAll, bool fastSwing, string description)
public AdaptiveLookback(Bars bars, int howManySwings, bool UseAll, bool fastSwing, bool preciseDetection, string description)

public AdaptiveLookback(Bars bars, bool fastSwing, string description)
public AdaptiveLookback(Bars bars, bool fastSwing, bool preciseDetection, string description)

public static AdaptiveLookback Series(Bars bars, int howManySwings, bool UseAll)
Parameter Description
| bars | A Bars object |
| howManySwings | How many recent swing points to take when computing the indicator |
| UseAll | When true, uses all swing points in the data |
| fastSwing | When true, takes 1 bar after a swing point (vs. 2 bars by default aka "Gann swing") |
| preciseDetection | Note: applicable only when fastSwing is true. When true, the high of the bar preceding a swing high or the low of the bar preceding a swing low can not be equal to the swing bar's high/low, respectively. |
Description
The Adaptive Lookback (period finder) created by Gene Geren is truly a market-driven indicator used to determine the variable lookback period for many different indicators, instead of a traditional, fixed figure.
It is based on the frequency of market swings - the time between swing highs or swing lows. A swing high is defined as two consecutive higher highs followed by two consecutive lower highs; a swing low is defined by two consecutive lower lows followed by two consecutive higher lows. As swing points typically accompany reversals, they occur more frequently in choppier and volatile markets than in trends.
With the
fastSwing option enabled, it takes two consecutive bars before the swing point and just one after - for faster detection. The high of the bar preceding a swing high or the low of the bar preceding a swing low can be equal to the swing bar's high/low, respectively.
Here is how the variable lookback period is determined:
- Determine the initial number of swing points to use in the calculation.
- Count the number of price bars it takes for the n swing points to form.
- Divide step 2 by step 1 and round the result.
Parameterless adaptive lookback
Starting from version 2013.01 of Community Indicators, a parameterless adaptive lookback has been added. An overloaded call without the
howManySwings and
UseAll parameters introduces a special logic that does not require averaging over previous N swing points. This makes the already self-adjusting, adaptive indicator
parameterless.
public AdaptiveLookback(Bars bars, bool fastSwing, string description)
public AdaptiveLookback(Bars bars, bool fastSwing, bool preciseDetection, string description)
The adaptive lookback period is determined simply as the distance between two swing points of the same direction, i.e. between two latest Swing Highs
or between two latest Swing Lows.
Interpretation
This makes the variable lookback period grow in calm or trending markets, and shorten in range-bound and volatile markets. For a trend-following system you would like the opposite to prevent being whipsawed, therefore this indicator is more suitable for short-term traders and counter-trend systems.
Experiment with applying the adaptive lookback period to different indicators and you'll see how more responsive they become in volatile markets.
Example
This example illustrates how to construct and plot the "traditional" Adaptive RSI indicator. The lookback period is based on the Adaptive Lookback readings. This technique can be easily applied to other indicators such as price channels and oscillators.
using System;
using System.Collections.Generic;
using System.Text;
using System.Drawing;
using WealthLab;
using WealthLab.Indicators;
using Community.Indicators;

namespace WealthLab.Strategies
{
	public class AdaptiveLookbackDemo : WealthScript
	{
		private StrategyParameter paramSwings;

		public AdaptiveLookbackDemo()
		{
			paramSwings = CreateParameter("Nr. of swings", 6, 1, 20, 1);
		}

		protected override void Execute()
		{
			// Create an instance of the AdaptiveLookback indicator class
			AdaptiveLookback ap = AdaptiveLookback.Series( Bars, paramSwings.ValueInt, false );
			DataSeries adaptiveRSI = new DataSeries( Bars, "Adaptive RSI" );
			RSI rsi = RSI.Series(Close, 14);

			// Build the adaptive RSI series
			for (int bar = ap.FirstValidValue; bar < Bars.Count; bar++)
				adaptiveRSI[bar] = RSI.Series( Close, Math.Max( 1, (int)ap[bar] ) )[bar];

			LineStyle solid = LineStyle.Solid;
			ChartPane arPane = CreatePane( 50, true, true ); HideVolume();
			PlotSeries( arPane, adaptiveRSI, Color.Blue, solid, 2 );
			PlotSeries( arPane, rsi, Color.DarkBlue, solid, 1 );
			DrawHorzLine( arPane, 70.0, Color.Red, LineStyle.Dashed, 1 );
			DrawHorzLine( arPane, 30.0, Color.Blue, LineStyle.Dashed, 1 );
		}
	}
}
Notice how much responsive can the Adaptive RSI be compared to its traditional 14-bar version on this 30-minute chart of Cisco Systems:
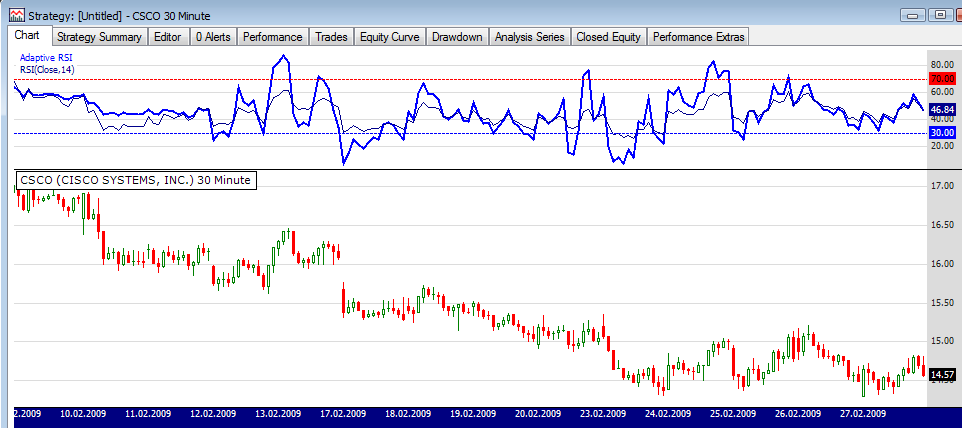 Adaptive RSI (CSCO, 30-minute) |
Example (Parameterless)
The following example illustrates the construction of a "parameterless" Adaptive RSI indicator:
using System;
using System.Collections.Generic;
using System.Text;
using System.Drawing;
using WealthLab;
using WealthLab.Indicators;
using Community.Indicators;

namespace WealthLab.Strategies
{
	public class AdaptiveLookbackDemo : WealthScript
	{
		private StrategyParameter paramSwings;

		public AdaptiveLookbackDemo()
		{
			paramSwings = CreateParameter("Nr. of swings", 6, 1, 20, 1);
		}

		protected override void Execute()
		{
			// Create an instance of the AdaptiveLookback indicator class
			AdaptiveLookback ap = new AdaptiveLookback( Bars, false, "Parameterless Adaptive Lookback" );
			AdaptiveLookback apFast = new AdaptiveLookback( Bars, true, "Parameterless Adaptive Lookback (Fast)" );
			DataSeries adaptiveRSI = new DataSeries( Bars, "Adaptive RSI" );
			DataSeries adaptiveRSIFast = new DataSeries( Bars, "Adaptive RSI (Fast)" );
			RSI rsi = RSI.Series(Close, 14);

			// Build the adaptive RSI series
			for (int bar = ap.FirstValidValue; bar < Bars.Count; bar++)
			{
				adaptiveRSI[bar] = RSI.Series( Close, Math.Max( 1, (int)ap[bar] ) )[bar];
				adaptiveRSIFast[bar] = RSI.Series( Close, Math.Max( 1, (int)apFast[bar] ) )[bar];
			}

			LineStyle solid = LineStyle.Solid;
			ChartPane arPane = CreatePane( 50, true, true ); HideVolume();
			PlotSeries( arPane, adaptiveRSI, Color.Blue, solid, 2 );
			PlotSeries( arPane, adaptiveRSIFast, Color.Red, solid, 1 );
			PlotSeries( arPane, rsi, Color.Silver, solid, 1 );
			DrawHorzLine( arPane, 70.0, Color.Red, LineStyle.Dashed, 1 );
			DrawHorzLine( arPane, 30.0, Color.Blue, LineStyle.Dashed, 1 );

			ChartPane alPane1 = CreatePane( 40, true, true );
			PlotSeries( alPane1, ap, Color.Blue, solid, 1 );
			PlotSeries( alPane1, apFast, Color.Red, solid, 1 );
			DrawHorzLine( alPane1, 14, Color.Silver, LineStyle.Dashed, 1 );
		}
	}
}
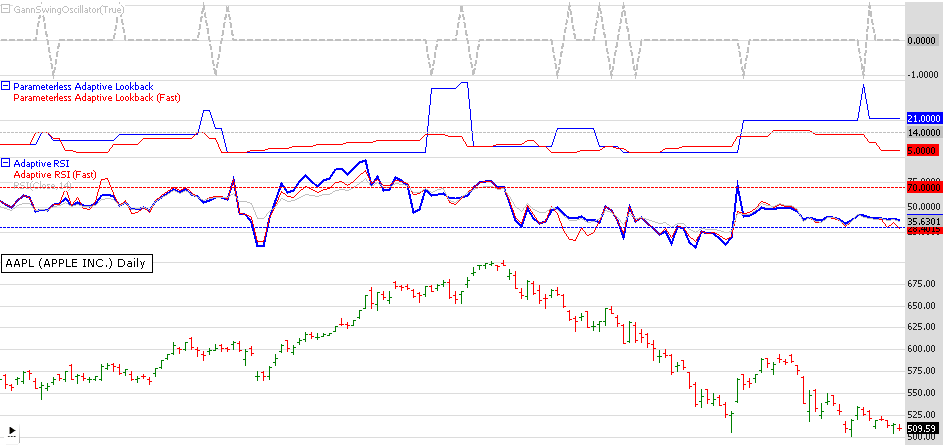 Parameterless Adaptive RSI |