Log in to see Cloud of Tags

Wealth-Lab Wiki

Trade Graphs | Streaks

RSS
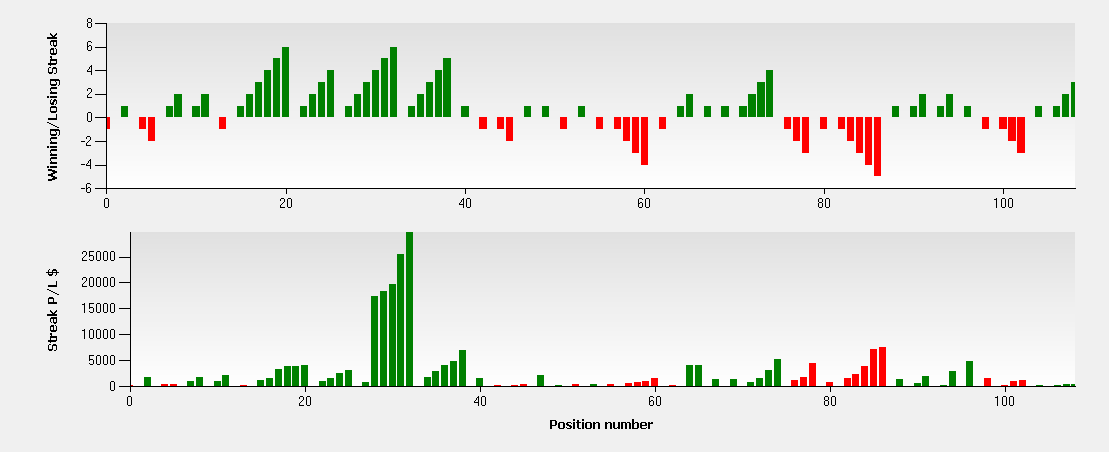
Plots winning/losing streaks vs. position number.

This graph visualizes consecutive winning and losing trades a.k.a. streaks (green and red consequently). The position number is Axis X while Axis Y plots the streak magnitude (upper pane) and its cumulative profit/loss $ (bottom pane).

In dropdown lists you can create breakdowns by the type of position (Total, Long or Short) as well as filter by individual instrument.

Winning/losing streaks

Winning/losing streaks


Double-click on a Position in a streak to center the Wealth-Lab chart on that trade.

Important Disclaimer: The information provided by Wealth-Lab is strictly for informational purposes and is not to be construed as advice or solicitation to buy or sell any security.  The owner of Wealth-Lab.com assumes no liability resulting from the use of the material contained herein for investment purposes. By using this web site, you agree to the terms of this disclaimer and our Terms of Use.


ScrewTurn Wiki. Some of the icons created by FamFamFam.