What is it
This is a fundamental data provider for Wealth-Lab version 6 and up that downloads free fundamental and economic data items from the
YCharts web site.
The full set of data is available to YCharts
paid subscribers only. Note: free trial may
not qualify and you won't get any data. However, many fundamental items are downloadable for free even if you don't have a subscription. YCharts restricts free fundamental data to the last 2-3 years. Economic data is available to paid subscribers only.
Setting up
Firstly you need to enter your email address and password in the provider's tab in Data Manager (
note: context sensitive!)
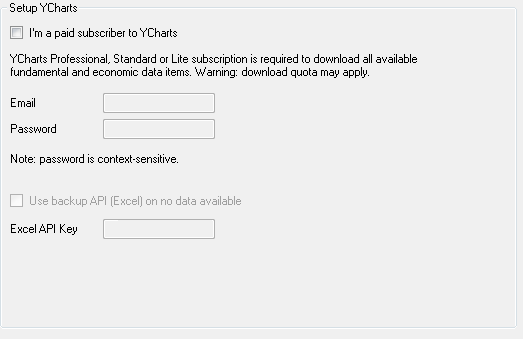 Enter username and password - YCharts paid plans only |
To start collecting 75+ fundamental items and 15+ economic data items provided by YCharts, check the provider's entries in Wealth-Lab's Data Manager tool (at the bottom of the "Update Data" tab). Now, Wealth-Lab will also collect fundamental data for all symbols and/or economic data after it finishes updating static data.
Provider supports data retrieval through the official Excel Addin API. Should the usual web downloads break you can paste in your Excel API Key (available in your Profile on YCharts website) and switch to the backup way.
Usage
Fundamental data downloads are available when you click "Update all data..." (and have at least one data provider selected from the list of installed provider) or when "Update DataSet" is selected.
Note: Fundamental items aren't collected when "Update DataSet (Pricing)" is selected.
Be patient while the provider is downloading the data. Although data downloads are multi-threaded, it could be a lengthy process for large portfolios. Since new fundamental data items become available every 3 months, it's recommended that you uncheck the provider's entry in the Data Manager for daily updates! If you fail to do it, you will
quickly run out of the monthly quota (which is only 25MB for the cheapest plan). Alternatively, switch to the limited free download mode.
Economic data items are updated only when "Update all data..." was clicked. Downloading this data does not depend on selected data provider, as economic items are global by nature and don't belong to a symbol. Please be patient while the data is downloaded (may take a minute).
Available fundamental items
YCharts makes available up to 30 years worth of quarterly fundamental items for the U.S. securities. The complete list of the available fundamental items is included:
- Free: Accounts Payable, Accounts Receivable, Assets, Cash Financing, Cash Investing, Cash On Hand, Cash Operations, Debt Equity Ratio, Dividend,
Dividend Yield, Earning Yield, Enterprise Value, EPS, Free Cash Flow, Gross Profit, Gross Profit Margin, Liabilities, Market Cap, Net Income, P/E Ratio, PEG Ratio, Price To Book Value, Profit Margin, R&D Expense, Revenues, SGA Expense, Shareholders Equity, Shares Outstanding - Pro (paid subscribers only): all of the "free" items listed above + Accruals, Asset Utilization, Book Value Of Equity, Book Value Of Tangible Equity, Book Value Per Share, Capex, Capex Annual, Cash And Equivalents, Cash Conversion Cycle, Cash Dividend Payout Ratio, Current Ratio, Days Inventory Outstanding, Days Payables Outstanding, Days Sales Outstanding, Depreciation Amortization Depletion, EBITDA, EBITDA Margin, Effective Tax Rate, EPS Growth, Estimated EPS / Estimated EBIDTA / Estimated Revenue (these 3 items are available for current quarter and 1/2/3 quarters forward), Expenses,
Free Cash Flow Yield, Free Cash Flow Per Share, FFO Per Share, Gain and Loss on Sale of PPE, Gain and Loss on Investment Securities, Gross Profit Annual, Income Before Ex Items And Disc Ops, Interest Expense, Interest Income, Inventories Net, Long Term Debt, Long Term Investments, Net PPE, Net Total Long Term Debt, Operating Earning Yield, Operating Margin, Operating P/E Ratio, Other Comp Income, Payout Ratio, Quick Ratio, Receivables Turnover, Retained Earnings, Retained Earnings Growth, Return On Assets, Return On Equity, Return On Invested Capital, Revenue Growth, Revenue Per Share, Stock Buyback, Tangible Book Value Per Share, Tangible Common Equity Ratio, Times Interest Earned, Total Changes In Assets Liabilities, Total Depreciation And Amortization, Total Long Term Assets
Items
in strikethrough have been excluded due to a big consumption of the download quota. They can be easily reconstructed in Strategy code. In pseudo-code:
- Price-To-Book Ratio = Close / "[yc] book_value_of_equity"
- P/E Ratio = Close / "[yc] eps"
- Earnings Yield = FundamentalDataSeriesAnnual("[yc] eps") / Close
- Market Capitalization = Close * "[yc] shares_outstanding"
- Dividend Yield = FundamentalDataSeriesAnnual("[yc] dividend") / Close
- Free Cash Flow Yield = "[yc] free_cash_flow_per_share" / Close
- P/EG Ratio = (Close / "[yc] eps") / "[yc] eps_growth"
Wealth-Lab customers can request new items from YCharts extensive collection here:
Forum support thread.
Fundamental items can be charted from the
Fundamental Data dialog at any time by clicking the Fundamentals button in the Navigation or Function toolbars, from the Tools menu, a chart's right-click menu, or simply using the Ctrl+U shortcut.
Available economic items
On their website, YCharts provides hundreds of thousands of economic indicators (worldwide). Through this data provider it's possible to use only the core U.S. economic data items as they consume download quota:
- 10 Year Treasury Rate, 30 Year Mortgage Rate, 30 Year Treasury Rate, Auto Sales, Consumer Price Index, Durable Goods Orders, Effective Federal Funds Rate, Existing Home Sales, Housing Starts, Initial Claims fo Unemployment Insurance, Personal Consumption Expenditures, Producer Price Index, Purchasing Managers Index, Retail Sales, Total Nonfarm Payrolls, U.S. Inflation Rate, Unemployment Rate
Stock dividends
YCharts provides some extended data fields for dividend items: in addition to the Ex-Dividend date, you can make use of Declaration, Record and Payable dates, as well as Dividend Type. Each dividend item is associated with the ex-dividend date and comes with extra details attached:
DeclarationDate,
RecordDate,
PayableDates, and
DividendType. These are available in two forms:
- In a popup when mousing over an [yc] dividend item on a stock chart
- In WealthScript Strategoes via the GetDetail or FormatValue methods:
Make sure you've collected the YCharts fundamental data before running this Strategy:
using System;
using System.Collections.Generic;
using System.Text;
using System.Drawing;
using WealthLab;
using WealthLab.Indicators;

namespace WealthLab.Strategies
{
	public class MyStrategy : WealthScript
	{
		protected override void Execute()
		{
			// Illustrates how to handle YCharts's extended dividend information with GetDetail

			const char tab = '\u0009';
			string item = "[yc] dividend";
			IList<FundamentalItem> fList = FundamentalDataItems(item);
			ClearDebug();
			PrintDebug(Bars.Symbol + tab + "Item Count: " + fList.Count);
			foreach (FundamentalItem fi in fList)
			{
				PrintDebug(
					fi.Date.ToShortDateString() + tab +
					fi.Value.ToString() + tab +
					fi.GetDetail("DeclarationDate") + tab +
					fi.GetDetail("RecordDate") + tab +
					fi.GetDetail("PayableDate") + tab +
					fi.GetDetail("DividendType") + tab);
			}

		}
	}
}
Notes
- The data are refreshed on each update (like other WL6 fundamental data providers do), so it should be free from adjusting problems. This consumes quota.
- If some economic items didn't appear after downloading, try repeating the data update.
Images
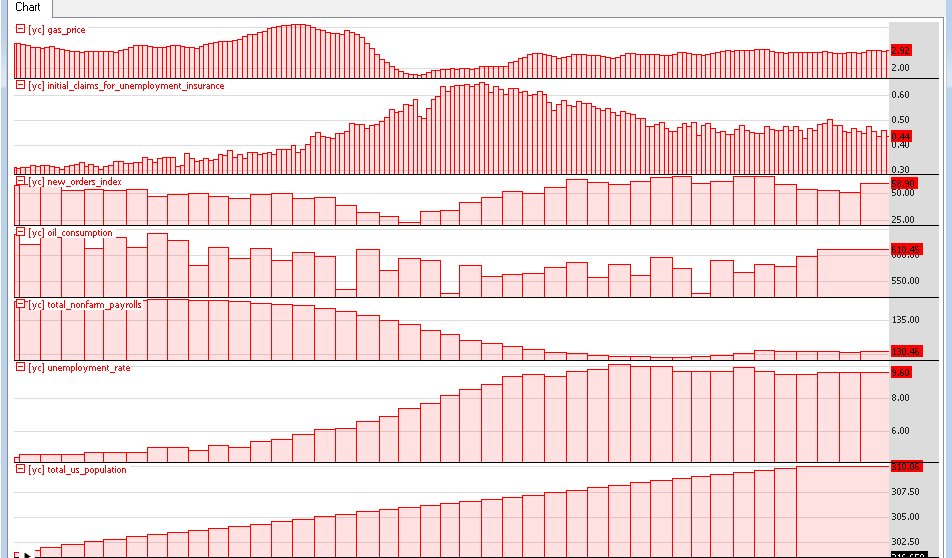
Here are some screenshots of the provider at work:
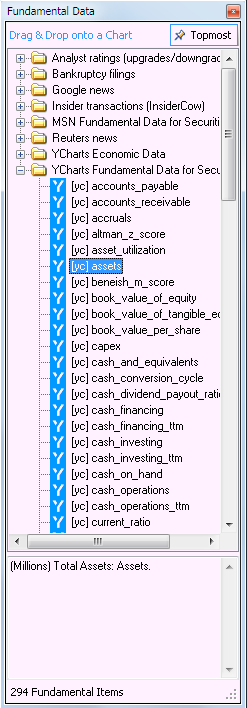 Some of the available fundamental data items |
| 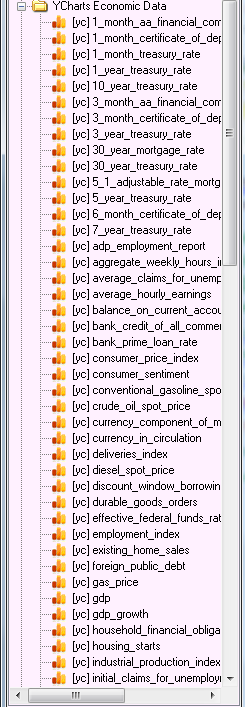 Some of the available economic data items |
|
 Economic data items |
|
Known issues