Traders' Tip text
We’ve added the VMACDH indicator to the TASCIndicator library to save you the trouble of typing in the few lines of code to create the indicator. Our script this month is a study for Wealth-Lab 5 that demonstrates how to access and plot the traditional and Volume-Weighted MACD histograms. It makes an attempt to quantify which MACD version sports the most frequent occurrences of “one bar wonders” by tallying the indicator series that “Turned Up” on or just prior to a 10% trough bar. On the chart, this is indicated by the highlight in the MACD pane (frequently occurring for both indicators simultaneously) and the total tallies are given in the upper left corner.
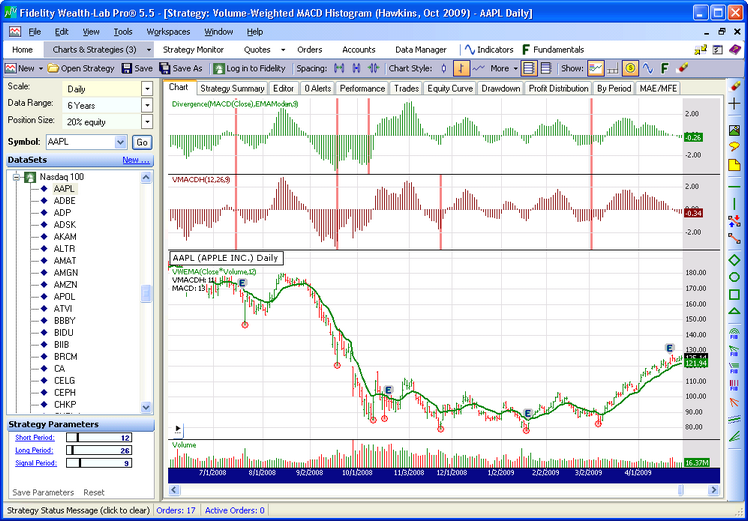 Figure 1.
 In our estimation, using VMACDH in this manner does not provide a statistically significant advantage over MACD.
WealthScript Code (C#)
using System;
using System.Collections.Generic;
using System.Text;
using System.Drawing;
using WealthLab;
using WealthLab.Indicators;
using TASCIndicators;

namespace WealthLab.Strategies
{
	public class MyStrategy : WealthScript
	{
		StrategyParameter _short;
		StrategyParameter _long;
		StrategyParameter _sig;

		public MyStrategy()
		{
			_short = CreateParameter("Short Period", 12, 5, 50, 2);
			_long = CreateParameter("Long Period", 26, 20, 100, 2);
			_sig = CreateParameter("Signal Period", 9, 2, 40, 1);
		}

		protected override void Execute()
		{
			EMACalculation calc = EMACalculation.Modern;
			int sPer = _short.ValueInt;
			int lPer = _long.ValueInt;
			int sigPer = _sig.ValueInt;

			ChartPane vPane = CreatePane( 40, true, true );
			ChartPane mPane = CreatePane( 40, true, true );

			// VMACDH from the TASCIndicator library
			DataSeries vmacdh = VMACDH.Series(Bars, sPer, lPer, sigPer);
			PlotSeries( vPane, vmacdh, Color.Maroon, LineStyle.Histogram, 1);

			// Make the traditional MACD Histogram
			DataSeries hist = Divergence.Series(MACD.Series(Close), MAType.EMAModern, 9);
			PlotSeries( mPane, hist, Color.Green, LineStyle.Histogram, 1);

			// A volume-weighted ema is easy enough to create in 1 statement
			DataSeries vwema = EMA.Series(Close * Volume, sPer, calc) / EMA.Series(Volume, sPer, calc);
			vwema.Description = "VWEMA(Close*Volume," + sPer + ")";
			PlotSeries(PricePane, vwema, Color.Green, LineStyle.Solid, 2);

			/* Highlight and tally the version of MACD that had the most-recent TurnUp
			   on or prior to the trough bar */
			int vwCount = 0;
			int maCount = 0;
			int bar = Bars.Count - 1;
			while( bar > 100 )
			{
				bar = (int)TroughBar.Series(Low, 10.0, PeakTroughMode.Percent)[bar];
				if( bar == -1 ) break;
				DrawCircle( PricePane, 8, bar, Low[bar], Color.Red, Color.FromArgb(70, Color.Red), LineStyle.Solid, 1, true );

				bool found = false;
				for (int n = bar; n > bar - 5; n--)
				{
					if( vmacdh[bar] < 0 && TurnUp(n, vmacdh) ) {
						SetPaneBackgroundColor(vPane, n, Color.LightCoral);
						vwCount++;
						found = true;
					}
					if( hist[bar] < 0 && TurnUp(n, hist) ) {
						SetPaneBackgroundColor(mPane, n, Color.LightCoral);
						maCount++;
						found = true;
					}
					if( found ) break;
				}
				bar--;
			}
			DrawLabel(PricePane, "VMACDH: " + vwCount);
			DrawLabel(PricePane, "MACD: " + maCount);
			PrintDebug(vwCount + "\t" + maCount);
		}
	}
}