Important revision!
The script presented for the magazine's Traders' Tip contained both logic and interpretation errors.
Revision A is now available.
Traders' Tip text
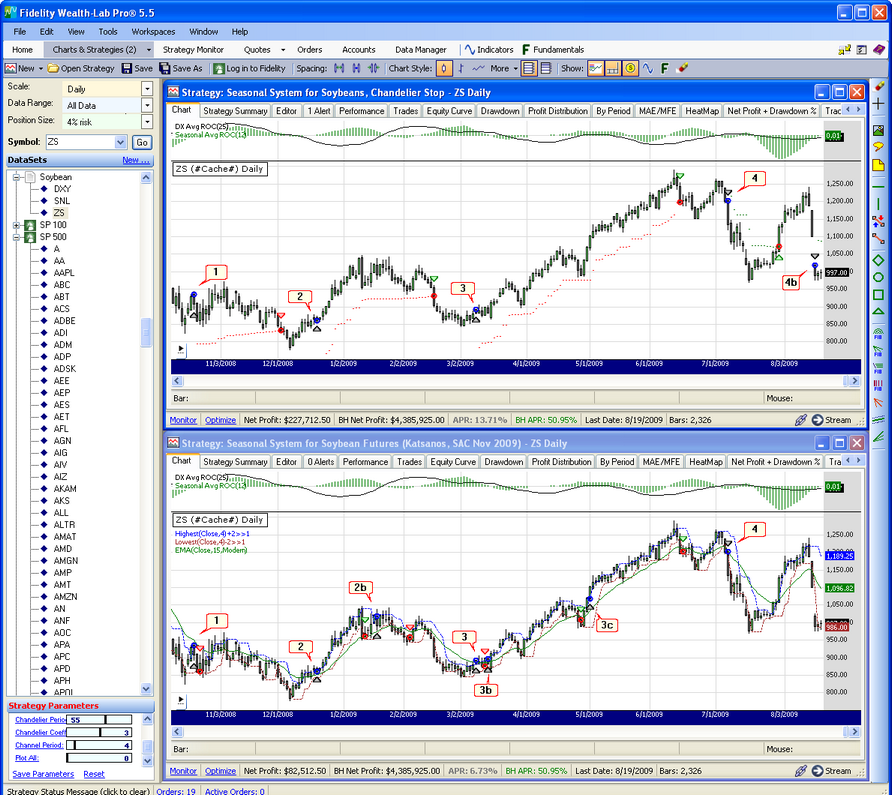
The soybean strategy was quite good at entering near the beginning of new trends, but occasionally got jiggled out of winning trades prematurely. We found that using a loose Chandelier stop as the only exit criteria with an arbitrary Fibonacci period of 55 and an ATR coefficient of 3.0 increased profitability of trading 1 contract (8.1% vs. 6.7% APR) and win rate (63.5% vs. 52.1%) while decreasing number of trades (63 vs. 71) and drawdown (6.13% vs. 6.55% based on $100K Starting Equity). Figure 1 illustrates how the new exit strategy generally helped to keep trades active longer with a well-defined risk.
 Figure 1.
 The strategy that used the Chandelier exit (top) often gave trades the wiggle room they needed for increased profitability, particularly for the trade labeled 3.
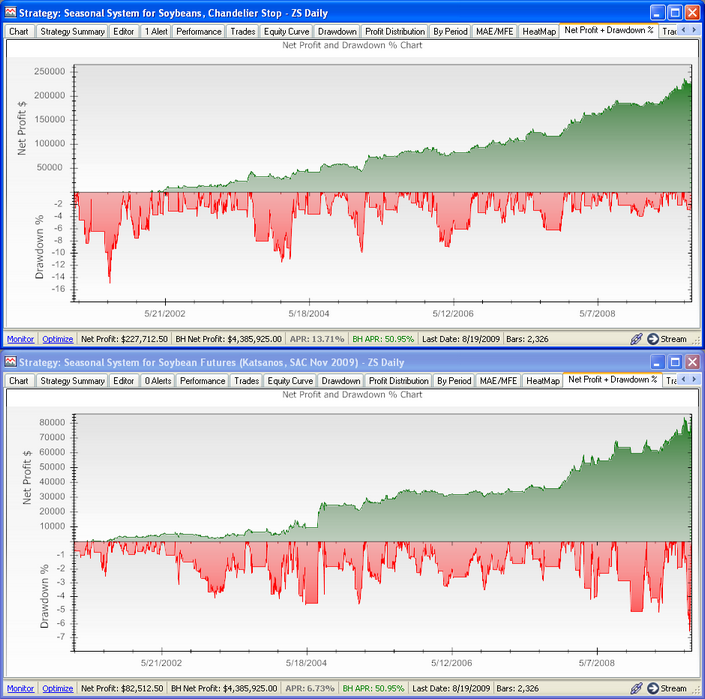
Taking it a step further, applying a 4% risk-stop position sizing strategy more than doubled profit at 16.1% APR ($50 per contract commissions) at the expense of doubling the max drawdown to 15.0%, which occurred at the front end of the backtest due to 6 of 8 losing trades (Figure 2). Risk-stop sizing specifies the percentage of portfolio equity that you’re willing to risk on a single trade. Allowing for greater risk, i.e., more contracts, magnifies the effect even more.
 Figure 2.
 Combining the Chandelier exit (top) with a 4% risk stop sizing strategy more than doubled profit with a well-defined exit, hence risk.
WealthScript Code (C#)
/* Seasonal Soybean Strategy with Chandelier exit */
using System;
using System.Collections.Generic;
using System.Text;
using System.Drawing;
using WealthLab;
using WealthLab.Indicators;
using Community.Components;

namespace WealthLab.Strategies
{
   public class MyStrategy : WealthScript
   {

      StrategyParameter D1DXY;
      StrategyParameter D2SNL;
      StrategyParameter LRSDXYSELL;
      StrategyParameter LRSNLSELL;
      StrategyParameter chandelierPeriod;
      StrategyParameter chandelierCoeff;
      StrategyParameter chnlLength;
      StrategyParameter doPlot;

      public MyStrategy()
      {
         D1DXY = CreateParameter("DX LRSlope Period", 25, 10, 50, 1);
         D2SNL = CreateParameter("Snl LRSlope Period", 12, 5, 25, 1);
         LRSDXYSELL = CreateParameter("DX LRSlope", 0.3, 0.1, 0.8, 0.1);
         LRSNLSELL = CreateParameter("Snl LRSlope", -0.8, -1.2, -0.5, 0.1 );
         chandelierPeriod = CreateParameter("Chandelier Period", 55, 8, 89, 1);
         chandelierCoeff = CreateParameter("Chandelier Coeff", 3, 1, 5, 0.5);
         chnlLength = CreateParameter("Channel Period", 4, 2, 20, 2);
         doPlot = CreateParameter("Plot All", 1, 0, 1, 1);
      }

      protected override void Execute()
      {
         // initialization for chandelier stop
         SeriesHelper obj = new SeriesHelper( this );
         double chandelierStop = 0.0;
         int cPer = chandelierPeriod.ValueInt;
         PlotStops();
         HideVolume();

         int buyMonth = 9; int sellMonth = 6;

         // Access external data
         Bars dxy = GetExternalSymbol("DXY", true);
         Bars snl = GetExternalSymbol("SNL", true);

         // Create and plot indicators
         DataSeries channelHiPlus2 = (Highest.Series(Close, chnlLength.ValueInt) + 2d) >> 1;
         DataSeries channelLoMinus2 = (Lowest.Series(Close, chnlLength.ValueInt) - 2d) >> 1;

         DataSeries dxyLR = LinearReg.Series(dxy.Close, D1DXY.ValueInt);
         DataSeries LRSDXY = ROC.Series( dxyLR, D1DXY.ValueInt ) / D1DXY.ValueInt;
         LRSDXY.Description = "DX Avg ROC(" + D1DXY.ValueInt + ")";

         DataSeries snlLR = LinearReg.Series(snl.Close, D2SNL.ValueInt);
         DataSeries LRSNL = ROC.Series(snlLR, D2SNL.ValueInt) / D2SNL.ValueInt;
         LRSNL.Description = "Seasonal Avg ROC(" + D2SNL.ValueInt + ")";

         ChartPane slopePane = CreatePane(20, true, true);
         PlotSeries(slopePane, LRSDXY, Color.Black, LineStyle.Solid, 1);
         PlotSeries(slopePane, LRSNL, Color.Green, LineStyle.Histogram, 1);

         if( doPlot.ValueInt == 1 )
         {
            PlotSeries(PricePane, channelHiPlus2, Color.Blue, LineStyle.Dashed, 1);
            PlotSeries(PricePane, channelLoMinus2, Color.Brown, LineStyle.Dashed, 1);
         }

         // Trading Strategy logic
         for(int bar = 3 * GetTradingLoopStartBar(1); bar < Bars.Count; bar++)
         {
            int month = Datebar.Month;
            bool seasonalBuy = month < sellMonth || month > buyMonth;
            bool seasonalShort = month > sellMonth && month < buyMonth;

            if (IsLastPositionActive)
            {
               Position p = LastPosition;
               // Chandelier stop value using Period: 14, Coefficient: 3
               chandelierStop = obj.ChandelierStop( Bars, bar, p, cPer, chandelierCoeff.Value );
               ExitAtTrailingStop(bar+1, p, chandelierStop);
            }
            else if ( seasonalBuy
               && LRSDXYbar < LRSDXYSELL.Value
               && Closebar > channelHiPlus2bar
               && LRSNLbar > LRSNLSELL.ValueInt )
            {
               RiskStopLevel = Closebar - 3d * ATR.Series(Bars, cPer)bar;
               BuyAtMarket(bar + 1);
            }
            else if (seasonalShort
               && LRSDXYbar > -LRSDXYSELL.Value
               && Closebar < channelLoMinus2bar
               && LRSNLbar < -LRSNLSELL.ValueInt )
            {
               RiskStopLevel = Closebar + 3d * ATR.Series(Bars, cPer)bar;
               ShortAtMarket(bar + 1);
            }
         }
      }
   }
}