Traders' Tip text
We took this opportunity to add both the Bollinger %b and the Sylvain Vervoort’s smoothed version to Wealth-Lab’s TASCIndicator library for Version 6. The WealthScript code shows how to access and plot both indicators, their standard deviation bands and parameter sliders. We have to wait for the author’s follow-up article for the indicator’s suggested use in a trading strategy; meanwhile, we look for price divergence as one would with the traditional %b indicator. At the time this went to print, the Nasdaq 100 appears to be setting up a peak divergence (Figure 1) just as it retests a prior trend-line support, creating a good context to be on watch for a reversal.
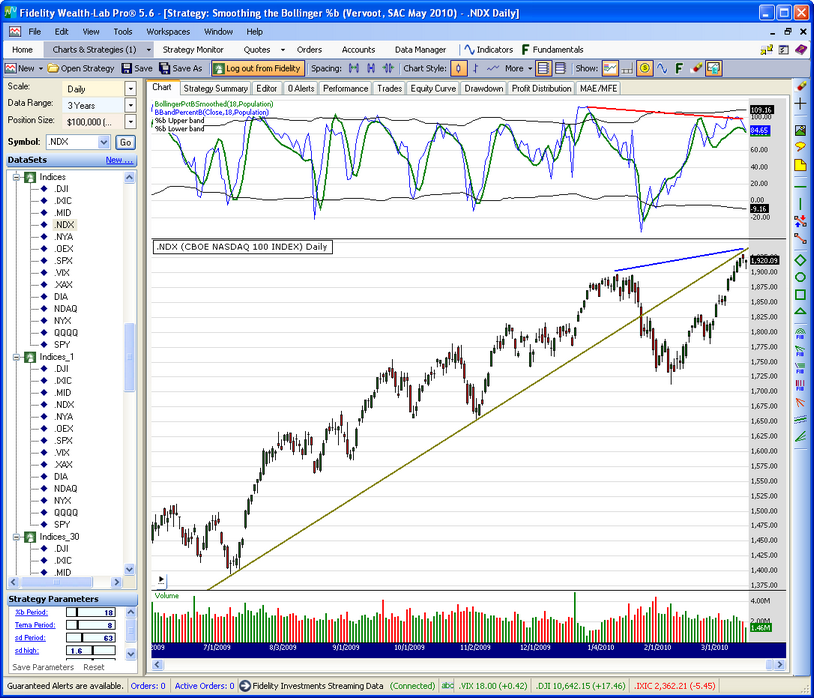 Figure 1.
 Is the Nasdaq finally setting up for a correction?
WealthScript Code (C#)
using System;
using System.Collections.Generic;
using System.Text;
using System.Drawing;
using WealthLab;
using WealthLab.Indicators;
using TASCIndicators;   /* %b indicators here */

namespace WealthLab.Strategies
{
   public class SVEpercentB : WealthScript
   {
      StrategyParameter _bPer;
      StrategyParameter _tPer;
      StrategyParameter _sdPer;
      StrategyParameter _sdhigh;
      StrategyParameter _sdlow;

      public SVEpercentB()
      {
         _bPer = CreateParameter("%b Period", 18, 10, 50, 1);
         _tPer = CreateParameter("Tema Period", 8, 2, 30, 1);
         _sdPer = CreateParameter("sd Period", 63, 5, 200, 1);
         _sdhigh = CreateParameter("sd high", 1.6, 0.1, 3.0, 0.1);
         _sdlow = CreateParameter("sd low", 1.6, 0.1, 3.0, 0.1);
      }

      protected override void Execute()
      {
         int TeAv = _tPer.ValueInt;
         int period = _bPer.ValueInt;
         StdDevCalculation sdc = StdDevCalculation.Population;

         // Bollinger %b and the SVE smoothed version
         DataSeries percb_sve = BollingerPctBSmoothed.Series(Bars, period, TeAv, sdc);
         DataSeries sdd = StdDev.Series(Close, 20, sdc);
         DataSeries percb = BollingerPctB.Series(Close, period, sdc);

         ChartPane cp = CreatePane(40, true, true);
         PlotSeries(cp, percb_sve, Color.Green, LineStyle.Solid, 2);
         PlotSeries(cp, percb, Color.Blue, LineStyle.Solid, 1);

         DataSeries percbUp = 50 + _sdhigh.Value * StdDev.Series(percb,_sdPer.ValueInt, sdc);
         DataSeries percbDn = 50 - _sdlow.Value * StdDev.Series(percb,_sdPer.ValueInt, sdc);
         percbUp.Description = "%b Upper band";
         percbDn.Description = "%b Lower band";
         PlotSeries(cp, percbUp, Color.Black, LineStyle.Solid, 1);
         PlotSeries(cp, percbDn, Color.Black, LineStyle.Solid, 1);
      }
   }
}