What it is
This is a suite comprised of static and fundamental providers that download daily (EOD) historical data from
Quandl website.
- free and subscription-based static EOD data for global instruments (futures, commodities, rates, stocks, indices, bonds, currencies...)
- free COT data (in legacy and new formats)
- free sentiment data (AAII, NYSE, NAAIM...)
- free historical U.S. Treasury yield curve rates
- subscription-based fundamental data by Zacks (up to 200 fundamental items, dividends, earnings esimates/surprises, analyst ratings)
More instruments can be supported. Please suggest your candidates for inclusion in this forum thread:
Setting up
It's a must that
before using the provider you obtain a so called
Auth Token from Quandl.com. To obtain it,
register on their website, activate your account and copy the sequence from Account Settings section of the website. To finish setup, either type it in the Data Manager's Quandl tab, or create a new static DataSet:
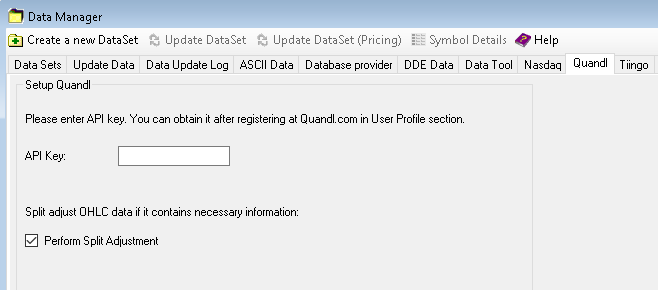 Enter Quandl auth token in Data Manager |
Note! Without completing this step, you will be able to make only 50 data requests per day.
Optionally, enable "Perform split adjustment" if you wish to run your backtests on the split-adjusted data. This only applies to the OHLC data (not Close-only) of participating vendors which provide "Split Ratio" in their data.
Finding symbols
Finding symbol tickers at Quandl is easy. A Quandl ticker always consists of two strings separated with slash: data collection name and data item name. Here's how it works.
For example, you wanted to get access to Crude Oil futures continuous contract and found it by the following link:
https://www.quandl.com/CHRIS/ICE_B1-ICE-Brent-Crude-Oil-Futures-Continuous-Contract-1-B1-Front-MonthThe highlighted part,
CHRIS/ICE_B1, is the unique ticker that you enter into Wealth-Lab. It always ends before the first "-" symbol in the URL.
How it works
Unlike most other data providers, it's important to understand how Quandl provider works. Quandl is a large data community where anyone can upload their data. Consequently, the data exists in a multitude of formats. The data is so far from being uniform that groups of related instruments (let's say futures) might have different field sets! The data for the same instrument can be paid and free. Free data can have defects (omissions, missing components for a data range etc.) This creates big problem for software developers who would like to support Quandl data. For example, in some software packages you have to manually configure each instrument through a configuration file. This is not the Wealth-Lab way.
Our solution is dynamic parsing. Wealth-Lab does all the low level job of recognizing the data format behind the scenes. It will recognize whether the data is simple OHLC for a stock, or it's a futures contract with special fields like Open Interest, or it's a Close-only currency, or sentiment data like Commitments of Traders, or some spot instrument or a rate. They've been uploaded by different vendors but you don't have to configure anything.
Like we already said, the free data can sometimes be quite dirty: for example, it may be missing certain fields for several months and then they reappear. In these cases, the provider has to make assumptions about the data and replace the missing Open, High, and/or Low fields with Close.
COT data
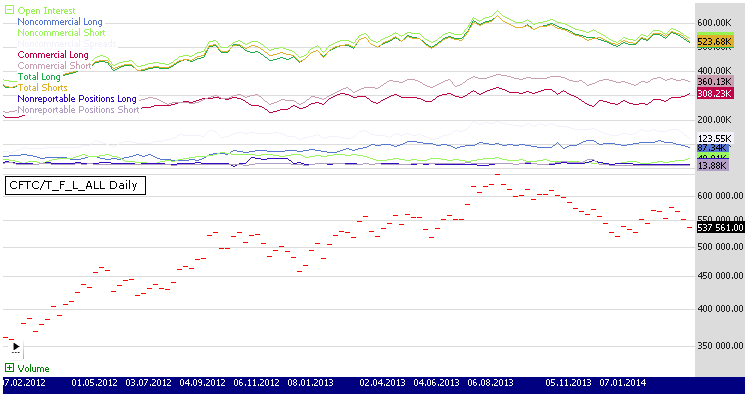
Among the many types of data, supported is Commitments of Traders data which can be downloaded in both legacy (e.g.
CFTC/T_F_ALL) and new formats (e.g.
CFTC/T_F_L_ALL) as well as open interest.
- Supported named series for symbols in new CFTC format:
Open Interest, Producer/Merchant/Processor/User Longs, Producer/Merchant/Processor/User Shorts, Swap Dealer Longs, Swap Dealer Shorts, Swap Dealer Spreads, Money Manager Longs, Money Manager Shorts, Money Manager Spreads, Other Reportable Longs, Other Reportable Shorts, Other Reportable Spreads, Total Reportable Longs, Total Reportable Shorts, Non Reportable Longs, Non Reportable Shorts- Supported named series for symbols in legacy CFTC format:
Open Interest, Noncommercial Long, Noncommercial Short, Noncommercial Spreads, Commercial Long, Commercial Short, Total Long
Total Shorts, Nonreportable Positions Long, Nonreportable Positions ShortHere's an example of plotting them all at once:
using System;
using System.Collections.Generic;
using System.Text;
using System.Drawing;
using WealthLab;
using WealthLab.Indicators;

namespace WealthLab.Strategies
{
	public class MyStrategy : WealthScript
	{
		Random r = new Random();

		private Color RandomColor()
		{
			Color randomColor = Color.FromArgb(r.Next(255), r.Next(255), r.Next(255));
			return randomColor;
		}

		protected override void Execute()
		{
			if( Bars.HasNamedDataSeries )
			{
				ChartPane p = CreatePane( 100, true, true );

				foreach( DataSeries ds in Bars.NamedSeries )
					PlotSeries( p, ds, RandomColor(), LineStyle.Solid, 1 );
			}
			else
				PrintDebug( Bars.Symbol + " does not contain named series" );
		}
	}
}
 CoT data by Quandl |
This example illustrates creation of a custom DataSeries from the COT Named Series data defined as
Commercial Long - Commercial Short and then applying RSI indicator to the custom DataSeries to normalize the custom index. It can only be used with Quandl symbols containing legacy series i.e. ending with "_L_ALL":
using System;
using System.Collections.Generic;
using System.Text;
using System.Drawing;
using WealthLab;
using WealthLab.Indicators;

namespace WealthLab.Strategies
{
   public class MyStrategy : WealthScript
   {
      protected override void Execute()
      {
         // For use on symbols containing legacy series i.e. symbols ending with "_L_ALL"

         if( Bars.HasNamedDataSeries )
         {
            DataSeries cl = Bars.FindNamedSeries("Commercial Long");
            DataSeries cs = Bars.FindNamedSeries("Commercial Short");
            DataSeries diff = cl - cs;
            RSI rsiDiff = RSI.Series( diff, 2 );
            rsiDiff.Description = "RSI on Difference between Commercial Long/Short";

            if( cl != null && cs != null )
            {
               ChartPane p2 = CreatePane( 25, true, true );
               ChartPane p1 = CreatePane( 25, true, true );
               ChartPane p = CreatePane( 25, true, true );

               PlotSeries( p, cl, Color.Green, LineStyle.Solid, 1 );
               PlotSeries( p, cs, Color.Red, LineStyle.Solid, 1 );
               PlotSeries( p1, diff, Color.Blue, LineStyle.Histogram, 2 );
               PlotSeriesOscillator( p2, rsiDiff, 70, 30, Color.FromArgb(30,Color.Red), Color.FromArgb(30,Color.Blue), Color.DarkMagenta, LineStyle.Solid, 1 );
            }
         }
         else
            PrintDebug( Bars.Symbol + " does not contain named series" );
      }
   }
}
U.S. Treasury yield curve data
Adding the
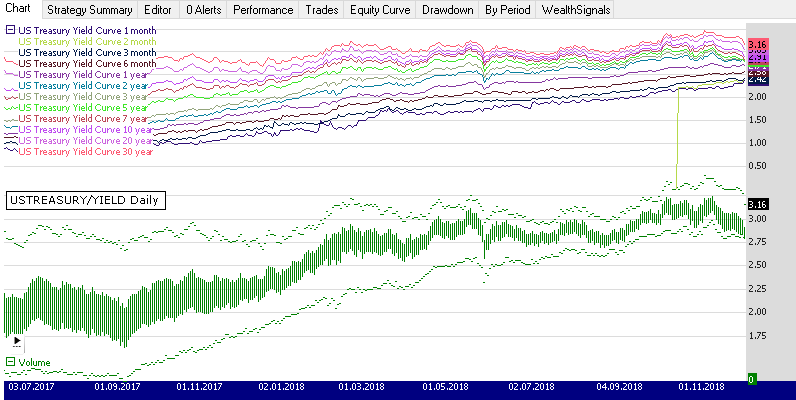
USTREASURY/YIELD symbol to your DataSet lets you have the history of all Treasury notes at once, short-term and long-term. The most requested 2-, 5-, 10- and 30-year Treasury rates are also plotted as virtual OHLC on the chart for convenience. The complete list of series spanning 1 month to 30 years is available as named DataSeries - just like AAII or COT data.
- Supported named series are:
US Treasury Yield Curve 1 month, US Treasury Yield Curve 2 month, US Treasury Yield Curve 3 month, US Treasury Yield Curve 6 month, US Treasury Yield Curve 1 year, US Treasury Yield Curve 2 year, US Treasury Yield Curve 3 year, US Treasury Yield Curve 5 year, US Treasury Yield Curve 7 year, US Treasury Yield Curve 10 year, US Treasury Yield Curve 20 year, US Treasury Yield Curve 30 year
For an example of plotting them all at once, see the first code sample for COT data right above.
 US Treasury data by Quandl |
AAII data
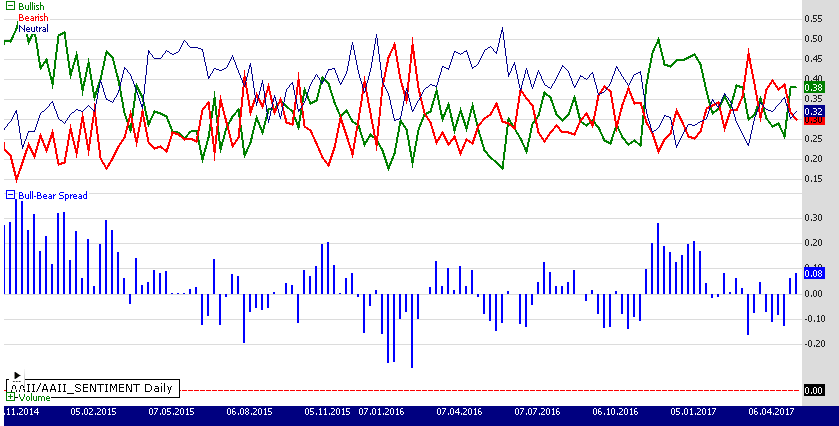
American Association of Individual Investors (AAII) publishes a weekly survey of investor sentiment since 1987. The AAII Investor Sentiment Survey measures the percentage of individual investors who are bullish, bearish, and neutral on the stock market for the next six months. Provider supports
this data as symbol
AAII/AAII_SENTIMENT and exposes poll results as Named DataSeries - much like COT data:
- Bullish, Bearish, Neutral, Bull-Bear Spread
 AAII data by Quandl |
This example illustrates how to plot the AAII named DataSeries. It can only be used with the Quandl symbol
AAII/AAII_SENTIMENT:
if( Bars.HasNamedDataSeries && Bars.Symbol == "AAII/AAII_SENTIMENT" )
{
	DataSeries bu = Bars.FindNamedSeries("Bullish");
	DataSeries be = Bars.FindNamedSeries("Bearish");
	DataSeries n = Bars.FindNamedSeries("Neutral");
	DataSeries s = Bars.FindNamedSeries("Bull-Bear Spread");

	if(bu != null && be != null && n != null && s != null)
	{
		ChartPane p1 = CreatePane( int.MaxValue, true, true );
		ChartPane p = CreatePane( int.MaxValue, true, true );

		PlotSeries( p, bu, Color.Green, LineStyle.Solid, 2 );
		PlotSeries( p, be, Color.Red, LineStyle.Solid, 2 );
		PlotSeries( p, n, Color.DarkBlue, LineStyle.Solid, 1 );
		PlotSeries( p1, s, Color.Blue, LineStyle.Histogram, 2 );
	}
}
else
	PrintDebug( Bars.Symbol + " does not contain named series" );
Other sentiment data
NYSE Factbook
Since 1958 NYSE publishes a monthly Factbook on Securities Market Credit data. It is comprised of the data for
Margin debt, Free credit cash accounts, and Credit balances in margin accounts. The Quandl symbol is
NYXDATA/MARKET_CREDIT. For more information you may refer to this article:
NYSE Margin Debt As An Indicator Of Long-Term Movements In S&P 500.
The data is supported as Named DataSeries only (so the chart appears blank):
- Margin debt, Free credit cash accounts, Credit balances in margin accounts
This example illustrates how to plot the NYSE Factbook named DataSeries. It can only be used with the Quandl symbol
NYXDATA/MARKET_CREDIT:
if( Bars.Symbol == "NYXDATA/MARKET_CREDIT" )
{
	if( Bars.HasNamedDataSeries )
	{
		DataSeries md = Bars.FindNamedSeries("Margin debt");
		DataSeries fc = Bars.FindNamedSeries("Free credit cash accounts");
		DataSeries cb = Bars.FindNamedSeries("Credit balances in margin accounts");

		if(md != null && fc != null && cb != null)
		{
			ChartPane p = CreatePane( int.MaxValue, true, true );
			PlotSeries( p, md, Color.Red, LineStyle.Solid, 2 );
			PlotSeries( p, fc, Color.Green, LineStyle.Solid, 2 );
			PlotSeries( p, cb, Color.Violet, LineStyle.Solid, 1 );
		}
	}
	else
		PrintDebug( Bars.Symbol + " does not contain named series" );
}
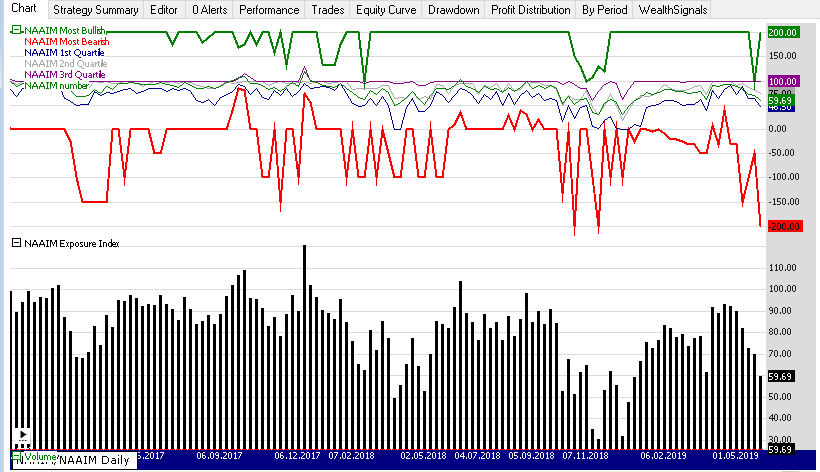
NAAIM
The NAAIM Exposure Index represents the average exposure to US equity markets reported by NAAIM member firms who are asked to provide a number which represents their overall equity exposure every week. Responses can range from 200% fully leveraged short position to 200% fully leveraged long position.
The Quandl symbol is
NAAIM/NAAIM. The following NamedSeries are available:
NAAIM Exposure Index, NAAIM Most Bullish, NAAIM Most Bearish, NAAIM 1st Quartile, NAAIM 2nd Quartile, NAAIM 3rd Quartile, NAAIM Standard Deviation, NAAIM number.
 NAAIM data by Quandl |
This example illustrates how to plot the NAAIM data. It can only be used with the Quandl symbol
NAAIM/NAAIM:
			if( Bars.HasNamedDataSeries && Bars.Symbol == "NAAIM/NAAIM" )
			{
				DataSeries n = Bars.FindNamedSeries("NAAIM Exposure Index");
				DataSeries bu = Bars.FindNamedSeries("NAAIM Most Bullish");
				DataSeries be = Bars.FindNamedSeries("NAAIM Most Bearish");
				DataSeries q1 = Bars.FindNamedSeries("NAAIM 1st Quartile");
				DataSeries q2 = Bars.FindNamedSeries("NAAIM 2nd Quartile");
				DataSeries q3 = Bars.FindNamedSeries("NAAIM 3rd Quartile");
				DataSeries sd = Bars.FindNamedSeries("NAAIM Standard Deviation");
				DataSeries num = Bars.FindNamedSeries("NAAIM number");

				if(n != null && bu != null && be != null && q1 != null && q2 != null && q3 != null
					&& sd != null && num != null)
				{
					ChartPane p1 = CreatePane( int.MaxValue, true, true );
					ChartPane p = CreatePane( int.MaxValue, true, true );

					PlotSeries( p, bu, Color.Green, LineStyle.Solid, 2 );
					PlotSeries( p, be, Color.Red, LineStyle.Solid, 2 );
					PlotSeries( p, q1, Color.DarkBlue, LineStyle.Solid, 1 );
					PlotSeries( p, q2, Color.DarkGray, LineStyle.Solid, 1 );
					PlotSeries( p, q3, Color.DarkMagenta, LineStyle.Solid, 1 );
					PlotSeries( p, num, Color.Green, LineStyle.Solid, 1 );
					PlotSeries( p1, n, Color.Black, LineStyle.Histogram, 3 );
				}
			}
			else
				PrintDebug( Bars.Symbol + " does not contain named series" );
FINRA short interest data
On Quandl you can get the
short interest volume provided by FINRA, separately for the trading on NYSE and NASDAQ. The symbol names for AAPL, for example, would be
FINRA/FNYX_AAPL (NYSE) and
FINRA/FNSQ_AAPL (Nasdaq), respectively.
The OHLC contains the Short Volume itself (i.e. aggregate reported share volume of executed short sale and short sale exempt trades during regular trading hours) while the Volume holds the Total Volume (aggregate reported share volume of all executed trades during regular trading hours) for given exchange.
ISM data
ISM publishes data on production and supply chains, new orders, inventories, and capital expenditures. Symbols starting with
ISM/MAN_ (manufacturing indices) and
ISM/NONMAN_ (non-manufacturing indices) are supported while any which start with
ISM/BUY_ are not.
Bitcoin data
If interested in Bitcoin, the symbols for BTC/USD are:
BCHARTS/BITSTAMPUSD and
BCHAIN/MKPRU. There are some supporting time series that the provider can recognize like number of Bitcoin users or exchange trade volume which are available in datasets like
Bitcoin Charts Exchange Rate Data and
Blockchain.
Issues and limitations
- While provider appends security names to symbols (starting from v2017.11), it cannot do so for the symbols in WIKI/ or EOD/ groups.
- Quandl has a fair usage policy and will throttle your data update if the provider makes more than 2000 calls in a 10 minute slot or if Quandl thinks it's "speeding". If you experience that part of a big DataSet hasn't been updated or a supported symbol suddenly returns "No data", try this:
- When doing an initial backfill, break up your big DataSet in parts and update them manually.
- If updating a big DataSet starts returning 0 bars, take a break and repeat shortly.
- Prior to v2018.02, provider did not support adjustment for splits. To maintain your data in good shape in a previous version, either perform splits manually or reload the DataSet from scratch using the Data Tool's "Remove all data" feature and then updating the DataSet. (Still required if you need to adjust for dividends as the provider doesn't do it.) To split-adjust your OHLC data (e.g. in the WIKI/ group):
- Update to v2018.02
- Enable "Perform split adjustment" on the Data Manager's Quandl tab
- If you had accumulated data for a compatible DataSet (e.g. WIKI/), reload the data for the symbols you wish to apply the feature. You can do it by right-clicking a symbol's chart and selecting "Reload chart history", or by using the DataToolData Tool]'s "Remove all data".
- Update your DataSet(s) the usual way for the new data which includes splits and dividends to download to your disk.
- Optionally, enable "Split (Quandl)" and "Dividend (Quandl)" in Wealth-Lab's Preferences > Chart Annotations and reopen the chart for the change to apply.