Traders' Tip text
Because of the interesting tail-recursion type of construction of the SVE Inverse Fisher RSI indicator, we included it with this month’s script. For the often-neglected bears out there, our WealthScript code includes a simple shorting Strategy which triggers and entry when a) SVE_IF_RSI crosses under 70, and, b) price negatively diverges with the ARSI. We employed rudimentary divergence detection that keys off the two ARSI peaks just prior to the SVE_IF_RSI trigger. The technique compares the relative price peaks corresponding to the ARSI peak bars, and, if a negative divergence is detected the script draws in the divergence lines and initiates a short Position. For simplicity, we exit the Position after 7 bars.
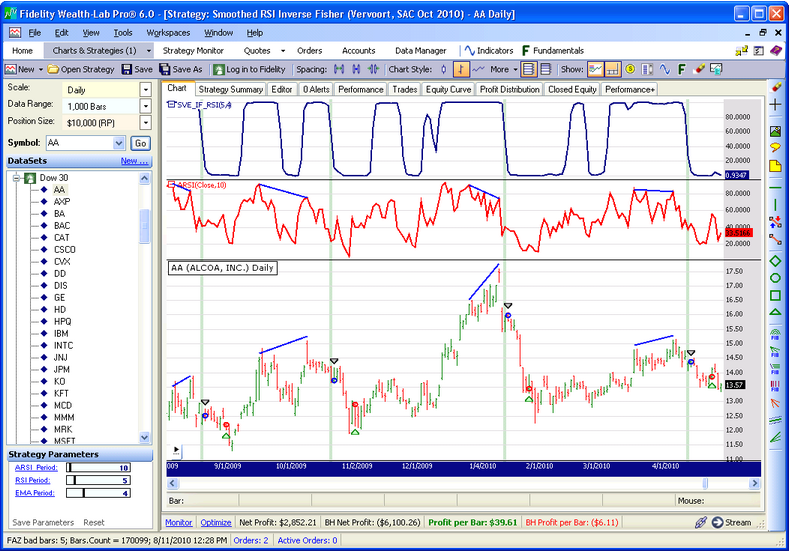 Figure 1.
 While the strategy is not expected to work so well on all stocks, the four most-recent short trades for Alcoa would have worked out quite well.
WealthScript Code (C#)
using System;
using System.Collections.Generic;
using System.Text;
using System.Drawing;
using WealthLab;
using WealthLab.Indicators;
using TASCIndicators;

namespace WealthLab.Strategies
{
	public class ShortDivergence : WealthScript
	{
		StrategyParameter _rsiPeriod;
		StrategyParameter _emaPeriod;
		StrategyParameter _arsiPeriod;

		public ShortDivergence()
		{
			_arsiPeriod = CreateParameter("ARSI_Period", 10, 2, 200, 20);
			_rsiPeriod = CreateParameter("RSI Period", 4, 2, 30, 1);
			_emaPeriod = CreateParameter("EMA Period", 4, 2, 10, 1);
		}

		public DataSeries SVEInvFisherRSI(int rsiPeriod, int emaPeriod)
		{
			DataSeries rbw = WMA.Series(Close, 2);
			DataSeries sve = 5 * rbw;

			for (int w = 4; w >= -4 ; w--)
			{
				rbw = WMA.Series(rbw, 2);
				if (w > 1 ) sve += (w * rbw);
				else 		sve += rbw;
			}
			sve /= 20d;
			sve.Description = "SVE Rainbow";
			//PlotSeries(PricePane, sve, Color.Blue, LineStyle.Solid, 2);

			DataSeries x = 0.1 * (RSI.Series(sve, rsiPeriod) - 50);
			DataSeries e1 = EMA.Series(x, emaPeriod, EMACalculation.Modern);
			DataSeries e2 = EMA.Series(e1, emaPeriod, EMACalculation.Modern);
			DataSeries z1ema = e1 + (e1 - e2);
			z1ema = (InverseFisher.Series(z1ema) + 1) * 50;
			z1ema.Description = "SVE_IF_RSI(" + rsiPeriod + "," + emaPeriod + ")";
			return z1ema;
		}

		protected override void Execute()
		{
			HideVolume();
			const double d = 1.01;
			int perRSI = _rsiPeriod.ValueInt;
			int perEMA = _emaPeriod.ValueInt;

			/* Create and plot indicators */
			DataSeries arsi = ARSI.Series(Close, _arsiPeriod.ValueInt);
			ChartPane rsiPane = CreatePane(40, true, true);
			PlotSeries(rsiPane, arsi, Color.Red, LineStyle.Solid, 2);

			DataSeries invfish = SVEInvFisherRSI(perRSI, perEMA);
			ChartPane cp = CreatePane(40, true, true);
			PlotSeries(cp, invfish, Color.Navy, LineStyle.Solid, 2);

			/* Trading loop */
			for (int bar = 3 * GetTradingLoopStartBar(4) ; bar < Bars.Count; bar++)
			{
				if (IsLastPositionActive)
				{
					Position p = LastPosition;
					if (bar + 1 - p.EntryBar > 6)
						ExitAtMarket(bar + 1, p, "Time-based");
				}
				else if (CrossUnder(bar, invfish, 70))
				{
					// check the last two arsi peaks for negative divergence with price
					int pb1 = (int)PeakBar.Value(bar, arsi, 20, PeakTroughMode.Value);
					if (pb1 == -1) continue;
					int pb2 = (int)PeakBar.Value(pb1, arsi, 20, PeakTroughMode.Value);
					if (pb2 == -1) continue;
					if ( Math.Sign(arsi[pb1] - arsi[pb2]) == -1 && Math.Sign(High[pb1] - High[pb2]) == 1)
					{
						SetBackgroundColor(bar, Color.FromArgb(50, Color.Green));
						DrawLine(rsiPane, pb2, arsi[pb2], pb1, arsi[pb1], Color.Blue, LineStyle.Solid, 2);
						DrawLine(PricePane, pb2, High[pb2] * d, pb1, High[pb1] * d, Color.Blue, LineStyle.Solid, 2);
						ShortAtMarket(bar + 1);
					}
				}
			}
		}
	}
}