Traders' Tip text
Even if you don’t want to use corona charts for trading, your spouse might even be impressed with these colorful charts – mine was! We wrapped the indicator creation and plotting in a tidy SuperIndicators method so that all four indicators can be returned to a Strategy script in a single call. The full translation for Wealth-Lab 6 (.NET) WealthScript can be found in the TASC Traders’ Tips section at the Wealth-Lab.com Wiki site.
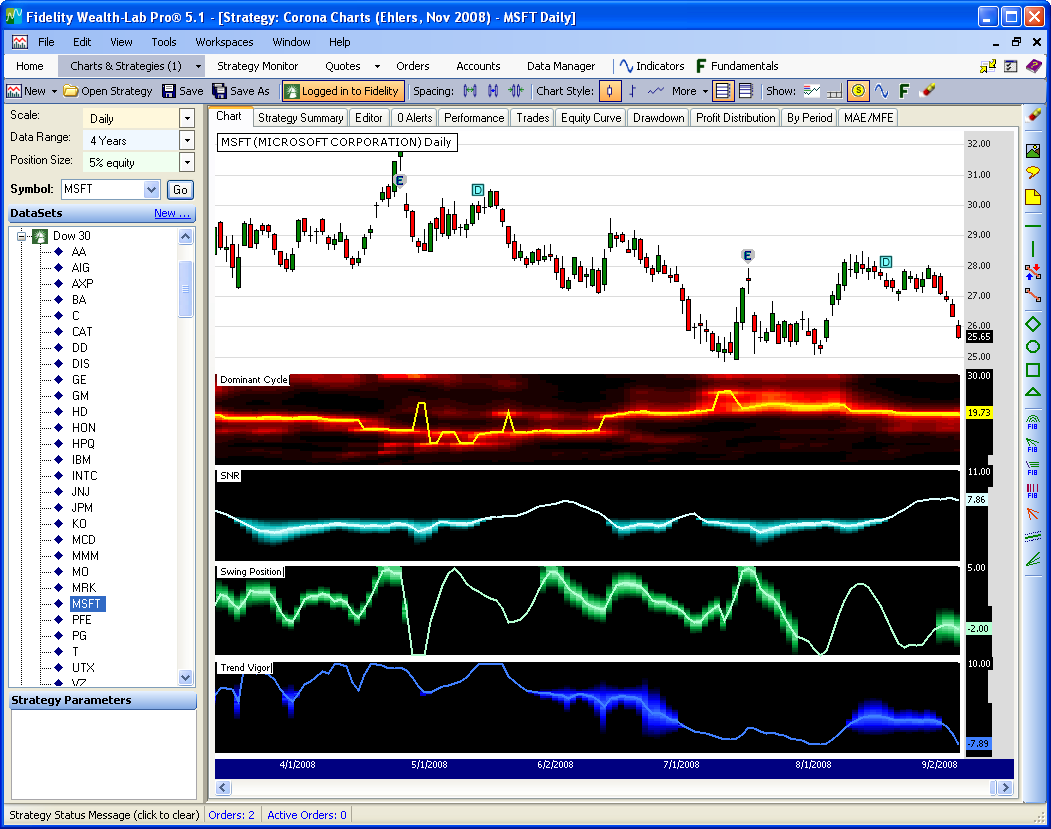 Figure 1.
 The Trend Vigor’s ominous corona in June provided a good warning that MSFT’s March-April rally had lost its steam.
Strategy Code
Revised: 20090611
Thanks to Wealth-Lab.com user "htg1", the calculation for the
Trend variable used for "Trend Vigor" is now correct. Additionally, the starting loop variable was changed from 12 to 51, and DataSeries initializations have been simplified.
// WAS:
double Trend = ds[bar] - ds[cycPeriod];


// SHOULD BE (IS):
double Trend = ds[bar] - ds[bar - cycPeriod];
/* Strategy Code revised 20090611 */
using System;
using System.Collections;
using System.Collections.Generic;
using System.Text;
using System.Drawing;
using WealthLab;
using WealthLab.Indicators;

namespace WealthLab.Strategies
{
	public class CoronaCharts : WealthScript
	{
		public const double twoPi = 2 * Math.PI;
		public const double fourPi = 4 * Math.PI;

		public class ArrayHolder
		{	// current, old, older
			internal double I, I2, I3;
			internal double Q, Q2, Q3;
			internal double R, R2, R3;
			internal double Im, Im2, Im3;
			internal double A;
			internal double dB, dB2;
		}

		// Keep cntMax fifo samples and find the Highest and Lowest lead for samples in the list
		private void PhaseList(ref ArrayList fifo, int cntMax, double lead, out double H, out double L)
		{
			H = lead; L = lead;
			if( fifo.Count < cntMax )
				fifo.Add(lead);
			else {
				fifo.RemoveAt(0);
				fifo.Add(lead);
			}
			for (int n = 0; n < fifo.Count - 1; n++) {
				double val = (double)fifo[n];
				if( val > H ) H = val;
				if( val < L ) L = val;
			}
		}

		public void SuperIndicators(DataSeries ds, out DataSeries domCycMdn, out DataSeries snrSer, out DataSeries psnSer, out DataSeries tvSer)
		{
			// Initialize arrays
			ArrayHolder[] ah = new ArrayHolder[61];
			for( int n = 12; n < 61; n++ )
				ah[n] = new ArrayHolder();

			double domCycle = 0d;
			string s = ds.Description + ")";
			DataSeries[] DB = new DataSeries[61];
			DataSeries domCyc = new DataSeries(Bars, "DC(" + s);
			domCycMdn = new DataSeries(Bars, "DomCyc(" + s);
			snrSer = new DataSeries(Bars, "SNR(" + s);
			psnSer = new DataSeries(Bars, "Swing Position(" + s);
			tvSer = new DataSeries(Bars, "Trend Vigor(" + s);

			// Create and plot the decibel series - change the colors later
			ChartPane dbPane = CreatePane(40, false, false );
			for( int n = 12; n < 61; n++ ) {
				double d = n / 2.0;
				DB[n] = domCyc + d;
				DB[n].Description = "Cycle." + d.ToString();
				PlotSeries(dbPane, DB[n], Color.Black, LineStyle.Solid, 4);
			}

			DataSeries[] Raster = new DataSeries[51];	// SNR Corona chart
			ChartPane snrPane = CreatePane(40, false, false );
			for( int n = 1; n < 51; n++ ) {
				double d = 1d + n / 5.0;
				Raster[n] = domCyc + d;
				Raster[n].Description = "SNR." + d.ToString();
				PlotSeries(snrPane, Raster[n], Color.Black, LineStyle.Solid, 4);
			}

			DataSeries[] RasterSwg = new DataSeries[51];	// Swing Corona chart
			ChartPane swgPane = CreatePane(40, false, false );
			for( int n = 1; n < 51; n++ ) {
				double d = 0.2 * n - 5.0;
				RasterSwg[n] = domCyc + d;
				RasterSwg[n].Description = "Swing." + d.ToString();
				PlotSeries(swgPane, RasterSwg[n], Color.Black, LineStyle.Solid, 4);
			}

			DataSeries[] RasterTV = new DataSeries[51];	// Trend Vigor Corona chart
			ChartPane tvPane = CreatePane(40, false, false );
			for( int n = 1; n < 51; n++ ) {
				double d = 0.4 * n - 10.0;
				RasterTV[n] = domCyc + d;
				RasterTV[n].Description = "TV." + d.ToString();
				PlotSeries(tvPane, RasterTV[n], Color.Black, LineStyle.Solid, 4);
			}

			Color[] color = new Color[21];		// Convert decibels to RGB color for display
			for( int n = 0; n <= 10; n++ )		// yellow to red: 0 to 10 dB
				color[n] = Color.FromArgb(255, (int)(255 - (255 * n / 10)), 0);
			for( int n = 11; n <= 20; n++ )		// red to black: 11 to 20 db
				color[n] = Color.FromArgb( (int)(255 * (20 - n)/10 ), 0, 0);

			Color[] colorSNR = new Color[21];	// Corona chart SNR colors
			for( int n = 0; n <= 10; n++ ) {
				int c1 = 220 - ( 22 * n );
				int c2 = 255 - ( 7 * n );
				colorSNR[n] = Color.FromArgb(c1, c2, c2);
			}
			for( int n = 11; n <= 20; n++ ) {
				int c2 = (int)(190 * ( 2 - n/10d ));
				colorSNR[n] = Color.FromArgb(0, c2, c2);
			}

			Color[] colorSwg = new Color[21];	// Corona chart Swing colors
			for( int n = 0; n <= 10; n++ ) {
				int c1 = 180 - ( 18 * n );
				int c2 = 255 - ( 8 * n );
				int c3 = 210 - ( 15 * n );
				colorSwg[n] = Color.FromArgb(c1, c2, c3);
			}
			for( int n = 11; n <= 20; n++ ) {
				int c2 = (int)(172 * ( 2 - n/10d ));
				int c3 = (int)(64 * ( 2 - n/10d ));
				colorSwg[n] = Color.FromArgb(0, c2, c3);
			}

			Color[] colorTV = new Color[21];	// Trend Vigor chart colors
			for( int n = 0; n <= 10; n++ ) {
				int c1 = 60 - ( 6 * n );
				int c2 = 120 - ( 12 * n );
				colorTV[n] = Color.FromArgb(c1, c2, 255);
			}
			for( int n = 11; n <= 20; n++ )
				colorTV[n] = Color.FromArgb(0, 0, (int)(255 * ( 2 - n/10d )));

			// Detrend data by High Pass Filtering with a 40 Period cutoff
			DataSeries HP = domCyc;
			double alpha = (1 - Math.Sin(twoPi/30)) / Math.Cos(twoPi/30);
			for(int bar = 1; bar < Bars.Count; bar++)
				HP[bar] = 0.5 * (1 + alpha)* Momentum.Series(ds, 1)[bar] + alpha * HP[bar-1];
			DataSeries smoothHP = FIR.Series(HP, "1,2,3,3,2,1");
			DataSeries hmlSer = Median.Series( High - Low, 5 );

			double avg, signal, noise, snr;	// Variables SNR
			double avg1 = 0d;
			double signal1 = 0d;
			double noise1 = 0d;

			const double delta2 = 0.1;		// Variables Swing, TV
			double BP2_1 = 0d;
			double BP2_2 = 0d;
			double beta2, BP2, g2, alpha2, Q2, Lead60, HL, LL, widthSwg;
			ArrayList fifoList = new ArrayList(51);
			ArrayList fifoPsn = new ArrayList(21);
			double ratio = 0d;
			double ratio1 = 0d;
			double widthTV = 0d;

			// arrays to hold raster values from previous bar
			int[] raster2 = new int[51];
			int[] raster2Swg = new int[51];
			int[] raster2TV = new int[51];

			for( int bar = 51; bar < Bars.Count; bar++ )
			{
				double maxAmpl = 0d;
				double delta = -0.015 * bar + 0.5;
				delta = delta < 0.1 ? 0.1 : delta;
				for( int n = 12; n < 61; n++ )
				{
					double beta = Math.Cos(fourPi / n);
					double g = 1 / Math.Cos(2 * fourPi * delta / n);
					double a = g - Math.Sqrt(g * g - 1);
					ah[n].Q = Momentum.Series(smoothHP, 1)[bar] * n / fourPi;
					ah[n].I = smoothHP[bar];
					ah[n].R = 0.5 * (1 - a) * (ah[n].I - ah[n].I3) + beta * (1 + a) * ah[n].R2 - a * ah[n].R3;
					ah[n].Im = 0.5 * (1 - a) * (ah[n].Q - ah[n].Q3) + beta * (1 + a) * ah[n].Im2 - a * ah[n].Im3;
					ah[n].A = ah[n].R * ah[n].R + ah[n].Im * ah[n].Im;
					maxAmpl = ah[n].A > maxAmpl ? ah[n].A : maxAmpl;
				}

				double num = 0;	double den = 0;
				for( int n = 12; n < 61; n++ )
				{
					ah[n].I3 = ah[n].I2;
					ah[n].I2 = ah[n].I;
					ah[n].Q3 = ah[n].Q2;
					ah[n].Q2 = ah[n].Q;
					ah[n].R3 = ah[n].R2;
					ah[n].R2 = ah[n].R;
					ah[n].Im3 = ah[n].Im2;
					ah[n].Im2 = ah[n].Im;
					ah[n].dB2 = ah[n].dB;

					if( maxAmpl != 0 && ah[n].A / maxAmpl > 0 )
						ah[n].dB = 10 * Math.Log10( (1 - 0.99 * ah[n].A / maxAmpl) / 0.01 );
					ah[n].dB = 0.33 * ah[n].dB + 0.67 * ah[n].dB2;
					ah[n].dB = ah[n].dB > 20 ? 20 : ah[n].dB;
					SetSeriesBarColor(bar, DB[n], color[(int)Math.Round(ah[n].dB)]);

					if( ah[n].dB <= 6 ) {
						num += n * (20 - ah[n].dB);
						den += (20 - ah[n].dB);
					}
					if( den != 0 ) domCycle = 0.5 * num / den;
				}
				domCycMdn[bar] = Median.Value(bar, domCyc, 5);
				domCycMdn[bar] = domCycle < 6 ? 6: domCycle;

				// Calculate SNR this bar
				signal = 0d;
				noise = 0d;
				snr = 0d;
				avg = 0.1 * ds[bar] + 0.9 * avg1;
				if( avg != 0d || maxAmpl > 0 )
					signal = 0.2 * Math.Sqrt(maxAmpl) + 0.9 * signal1;
				if( avg != 0d )
					noise = 0.1 * hmlSer[bar] + 0.9 * noise1;
				if( signal != 0d || noise != 0d )
					snr = 20 * Math.Log10(signal/noise) + 3.5;
				snr = snr < 1d ? 0d : snr;
				snr = snr > 10d ? 10d : snr;
				snr = snr * 0.1;
				snrSer[bar] = snr * 10 + 1;
				double Width = snr > 0.5 ? 0d : -0.4 * snr + 0.2;

				// Calculate the Swing this bar
				beta2 = Math.Cos(twoPi / domCycMdn[bar]);
				g2 = 1 / Math.Cos(fourPi * delta2 / domCycMdn[bar]);
				alpha2 = g2 - Math.Sqrt(g2 * g2 - 1);
				BP2 = 0.5 * (1 - alpha2) * (ds[bar] - ds[bar-2])
					+ beta2 * (1 + alpha2) * BP2_1 - alpha2 * BP2_2;
				//Quadrature component is derivative of InPhase component divided by omega
				Q2 = (domCycMdn[bar] / twoPi) * (BP2 - BP2_1);
				Lead60 = 0.5 * BP2 + 0.866 * Q2;
				PhaseList(ref fifoList, 50, Lead60, out HL, out LL);
				double Psn = (Lead60 - LL) / (HL - LL);
				PhaseList(ref fifoPsn, 20, Psn, out HL, out LL);
				if( HL - LL > 0.85 ) widthSwg = 0.01;
				else widthSwg = 0.15 * (HL - LL);
				psnSer[bar] = 10 * Psn - 5d;

				// Calculate Trend Vigor this bar
				// (Filter Bandpass component - same as Swing above; substitute variable names)

				//Pythagorean theorem to establish cycle amplitude
				double Ampl2 = Math.Sqrt(BP2 * BP2 + Q2 * Q2);

				//Trend amplitude taken over the cycle period
				int cycPeriod = (int)(domCycMdn[bar] - 1);
				if( cycPeriod < 12 ) cycPeriod = 12;
				double Trend = ds[bar] - ds[bar - cycPeriod];
				if( Trend != 0 && Ampl2 != 0 )
					ratio = 0.33 * Trend /Ampl2 + 0.67 * ratio1;
				if( ratio > 10 ) ratio = 10d;
				if( ratio < -10 ) ratio = -10d;

				double tv = 0.05 * (ratio + 10d);
				if( tv < 0.3 || tv > 0.7 ) widthTV = 0.01;
				if( tv >= 0.3 && tv < 0.5 ) widthTV = tv - 0.3;
				if( tv >= 0.5 && tv <= 0.7 ) widthTV = 0.7 - tv;
				tvSer[bar] = 20d * tv - 10d;

				/* Plot the rasters... */
				int snr50 = (int)Math.Round(50 * snr);
				int psn50 = (int)Math.Round(50 * Psn);
				int tv50  = (int)Math.Round(50 * tv);

				for( int n = 1; n < 51; n++ )
				{	// 0.4 used below comes from 20/50 to normalize the color from 1 to 20
					double raster = 20d;
					if( n < snr50 )  // bottom of corona
						raster = 0.5 * (Math.Pow((20 * snr - 0.4 * n) / Width, 0.8) + raster2[n]);
					else if( n > snr50 && (0.4 * n - 20 * snr) / Width > 1 )  // top of corona
						raster = 0.5 * (Math.Pow((-20 * snr + 0.4 * n) / Width, 0.8) + raster2[n]);
					else if( n == snr50 )
						raster = 0.5 * raster2[n];
					if ( raster > 20 ) raster = 20;
					else if ( raster < 0 ) raster = 0;
					if ( snr > 0.5 ) raster = 20;
					SetSeriesBarColor(bar, Raster[n], colorSNR[(int)(raster)]);
					raster2[n] = (int)raster;

					// Plot the Swing raster
					double rasterSwg = 20d;
					if( n < psn50 )  // bottom of corona
						rasterSwg = 0.5 * (Math.Pow((20 * Psn - 0.4 * n) / widthSwg, 0.95) + 0.5 * raster2Swg[n]);
					else if( n > psn50 && (0.4 * n - 20 * Psn) / widthSwg > 1 )  // top of corona
						rasterSwg = 0.5 * (Math.Pow((-20 * Psn + 0.4 * n) / widthSwg, 0.95) + 0.5 * raster2Swg[n]);
					else if( n == psn50 )
						rasterSwg = 0.5 * raster2Swg[n];
					if ( rasterSwg > 20 ) rasterSwg = 20;
					else if ( rasterSwg < 0 ) rasterSwg = 0;
					if ( HL - LL > 0.8 ) rasterSwg = 20;
					SetSeriesBarColor(bar, RasterSwg[n], colorSwg[(int)(rasterSwg)]);
					raster2Swg[n] = (int)rasterSwg;

					// Plot the Trend Vigor raster
					double rasterTV = 20d;
					if( n < tv50 )
						rasterTV = 0.8 * (Math.Pow((20 * tv - 0.4 * n) / widthTV, 0.85) + 0.2 * raster2TV[n]);
					else if( n > tv50 )  // top of corona
						rasterTV = 0.8 * (Math.Pow((-20 * tv + 0.4 * n) / widthTV, 0.85) + 0.2 * raster2TV[n]);
					else if( n == tv50 )
						rasterTV = 0.5 * raster2TV[n];
					if( rasterTV < 0 ) rasterTV = 0;
					if( rasterTV > 20 || tv < 0.3 || tv > 0.7 ) rasterTV = 20;
					SetSeriesBarColor(bar, RasterTV[n], colorTV[(int)(rasterTV)]);
					raster2TV[n] = (int)rasterTV;
				}
				avg1 = avg;
				signal1 = signal;
				noise1 = noise;
				BP2_2 = BP2_1;
				BP2_1 = BP2;
				ratio1 = ratio;
			}
			HideVolume();
			HidePaneLines();
			PlotSeries(dbPane, domCycMdn, Color.Yellow, WealthLab.LineStyle.Solid, 2);
			DrawLabel(dbPane, "Dominant Cycle|", Color.Black);
			PlotSeries(snrPane, snrSer, Color.FromArgb(220, 255, 255), LineStyle.Solid, 2);
			DrawLabel(snrPane, "SNR|", Color.Black);
			PlotSeries(swgPane, psnSer, Color.FromArgb(180, 255, 210), LineStyle.Solid, 2);
			DrawLabel(swgPane, "Swing Position|", Color.Black);
			PlotSeries(tvPane, tvSer, Color.FromArgb(64, 128, 255), LineStyle.Solid, 2);
			DrawLabel(tvPane, "Trend Vigor|", Color.Black);
		}

		protected override void Execute()
		{
			// Declare the DataSeries to pass to the method
			DataSeries dc, snr, swing, tv;

			// Get the dominant cycle, SNR, Swing Position, and Trend Vigor for use in a strategy
			SuperIndicators(AveragePrice.Series(Bars), out dc, out snr, out swing, out tv);
		}
	}
}