This Performance Visualizer displays Drawdown on percentage basis with moving average, based on open (unrealized) and closed closed equity basis (i.e. excluding unrealized profit/loss). Applies to Portfolio Simulation only. Equity and Drawdown curves are semi-transparent near initial values and get most saturated color at their extremes. In other words, the red gets darker as the drawdown deepens, the green gets darker as the profit is higher.
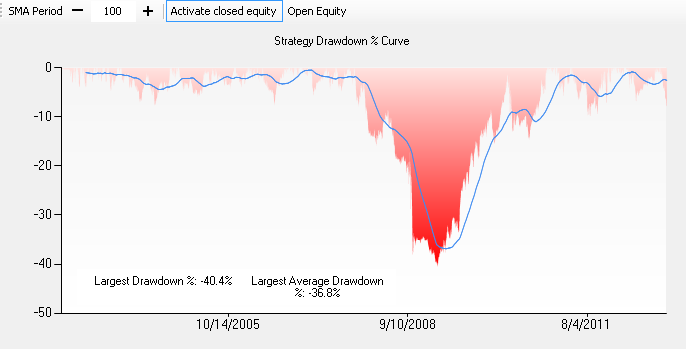 Open equity drawdown |
As calculating closed equity can get slow for large intraday backtests if the system is creating lots of positions, the closed equity view has been made optional. To enable the closed equity drawdown, first click on "Activate Closed Equity" and re-run the backtest. This will make it stay enabled until manual deactivation.
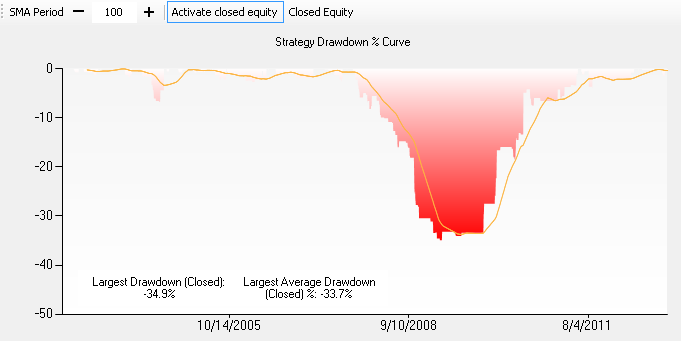 Closed equity drawdown |
To switch between open/closed equity drawdown, click on the "Open Equity" / "Closed Equity" button, indicating which mode is currently active.
The moving average period is configurable by either typing it in the text box, or by clicking the "-" and "+" buttons. The average drawdown curve will redraw as you type.
"Largest Drawdown % Including Intraday Excursions"
Background:
We've found that drawdowns for systems that exit the next day at market (e.g., dip buyer that sells at market the next day) tend to show a
considerably less drawdown than they actually experience on an intraday basis.
Starting from v2014.09, the Drawdown+ visualizer also shows the maximum drawdown % that includes
intraday excursions. The standard drawdown calculation is based on changes in the equity curve, which is calculated on each bar using cash and closing prices (only) of open positions. To arrive at a "worst case drawdown scenario", we make a special adjustment to this calculation: for long positions we find a position's value using the low of the bar; likewise for short positions, we use the bar's high. In essence, we are assuming that all open positions attain their worst-case contribution to equity simultaneously.
Notes:
- The worst-case drawdown calculation applies to open equity only
- It's conceivable for the worst-case value to be slightly more positive than the standard value. This can occur when the maximum drawdown values are derived from different dates due to the differences between the standard equity curve and the one modified for intraday excursions.