E-Ratio takes the MFE/MAE analysis a step further. In addition to the static value found on the
Performance+ tab, this visualizer plots the value dynamically i.e. on a bar by bar basis.
E-Ratio measures how much a trade goes in your favor vs. how much a trade goes against you. The number of bars since entry is on the X axis, the average E-Ratio is on axis Y. The higher the number the better your trading edge is supposed to be (if it's a positive value). E-Ratio is normalized for volatility to be applicable across different markets.
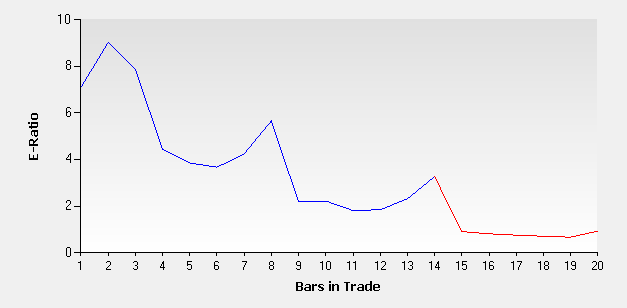 E-Ratio chart |
Calculation
T = total trade count
ATR = 14-bar ATR value
For a Position on a given bar, E-Ratio = (current MFE as of bar / ATR) / (current MAE as of bar / ATR)
1. On each bar X (where X varies from 0 to the longest trade duration):
a) Sum up the rolling E-Ratio of trades held for X bars or longer
b) Increment the number of trades held for X+ bars
2. Rolling E-Ratio = 1a (the sum of e-ratios) / 1b (how many trades were held for at least X bars)
Additional sources