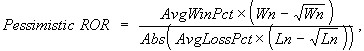
Wn = Number of Wins, Ln = Number of Losers, AvgWinPct = Average Win %, AvgLossPct = Average Loss%
Coefficient of Variation = Standard Deviation / Average (in %)
Expectancy = ((Probability of Win * Average Win) – (Probability of Loss * Average Loss)) / Average Risk
Expectancy = (Probability of Win * Average Win) – (Probability of Loss * Average Loss)
Risk of Ruin = ((1 - P)/P)^(MaxRisk/A),
A is the square root of the sum of the squares of possible events, (ProbWin*AvgWin%^ 2 + ProbLoss*AvgLoss%^2) ^ (1/2)