Dotted Chart Style
Modified on 2010/04/28 13:36 by Eugene — Categorized as: ChartStyles
The
Dotted
ChartStyle developed by user
dansmo
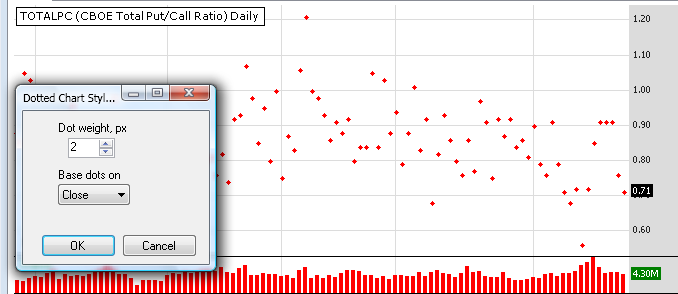
represents each bar on a chart as a dot. Dots can be drawn based on either Open, High, Low or Close price, and their widths can be configured in a settings dialog.
The default value of the dot is 2 pixels. Right-click the chart and select "Chart Style Settings" - or simply hit
Ctrl-Y
on your keyboard - to invoke the dialog where you can configure the chart style.
Dotted Chart Style in action (width = 2 pix)