AlphaVantage static data provider
Modified on 2020/09/11 07:15 by Administrator — Categorized as: Providers
What it is
This is a Wealth-Lab static and fundamental provider for
free
intraday and daily data for U.S. stocks, Forex and cryptocurrencies by
AlphaVantage
. The EOD data spans 20 years while the intraday data is limited depending on bar scale (1-minute: 1 week, 5-minute: 4 weeks, 15-, 30-minute: 6 weeks, 60-minute: less than 3 months for stocks and less than a month for Forex).
IMPORTANT NOTE for the FREE Service
The free service permits only 5 historical requests per minute. This is sufficient for viewing charts with on-demand updates, but will
not work
to update even a small DataSet using the Data Manager, which will attempt hundreds of requests every minute. In this case only the first 5 symbol requests will update and the rest will fail.
If you're familiar with the built-in Yahoo! provider, you're going to get common with the Alphavantage provider very quickly. Its features include:
the split and dividend history for U.S. stocks is stored locally and can be optionally applied to price data. This means that DataSet refreshes are never required in order to apply the most-recent split and dividend data.
Chart Annotations: "Split (AlphaVantage)" and "Dividend (AlphaVantage)".
On-demand data requests supported.
Support for
GetSessionOpen
, Strategy Monitor and
Market Manager
.
Setting it up
Before you're able to download any data, follow these steps:
Install the
extension
and restart WLP/D
Get your
free
API key at
AlphaVantage.co
or subscribe and get a
premium
key at
AlphaVangtage Premium
Copy and paste your API key (no typing !) on the Data Manager's
AlphaVantage
tab
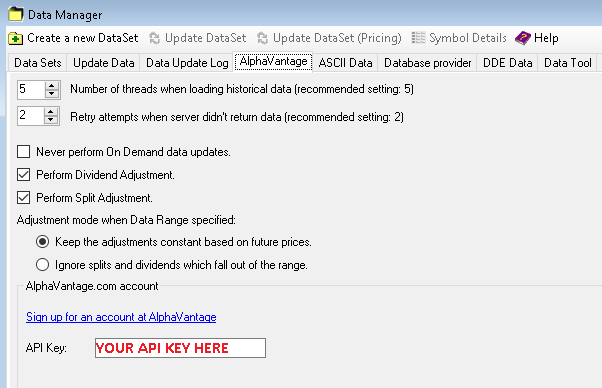
Provider tab in Data Manager
Never perform On Demand data updates
: Overrides Wealth-Lab's On demand update option so that backtests in the Strategy Window/Monitor always run quickly with cached data.
Perform Dividend/Split Adjustment
: Data are adjusted at the moment they're passed to Wealth-Lab by the AlphaVantage provider so that the newest dividends are applied automatically to the price data. Note that split and dividend adjustments affect both price and volume. The dividend adjustment factor equation is
1 - dividend/close
. Prices (pre-ex-date) are multiplied by the adjustment factor(s), whereas the factor becomes the divisor for volume.
Adjustment mode when Data Range specified
: Choose "Keep" so that price and volume data are always the same, historically, even when specifying a past data range. "Ignore" is an advanced option for testing with past adjusted data without the influence of future splits or dividends that are excluded from the chart's Date Range.
To use the right-click bar data editor for anything besides deleting a bar in a AlphaVantage chart, you must apply the "Keep" option during the edit. See Data Editing below.
Forex
Forex symbols must have
FFF/TTT
format, where
FFF
stands for From-Symbol and
TTT
stands for To-Symbol, for example: EUR/USD, USD/CHF etc.
Cryptocurrencies
We tested cryptos with
FFF-TTT
format, where
FFF
stands for From-Symbol and
TTT
stands for To-Symbol, for example: BTC-USD.
Working with Dividends
The fundamental provider may return split-adjusted dividends for a chart's dividend popup as well as when accessing the "Dividend (Alphavantage)" fundamental item in Strategy code. While the dividend adjustment factor maintains proper percentage relationships between prices, it's possible that new dividends affect previous backtest results (trades) for some strategies. Disable "Apply dividends" in the Backtest Settings Preferences when using dividend-adjusted data for backtesting. If you don't, the dividend effect might be duplicated in the Performance results, especially for the Buy & Hold Strategy.
Data Editing
To edit bar data, open a chart and either:
double-click the bar to edit, or,
right-click the bar and select Edit Bar Data.
When editing data, be aware of the Perform Dividend Adjustment selection since the chart values will reflect this adjustment. Deselect this option and refresh the chart to edit raw price and volume.
With the "Ignore splits and dividends which fall out of the range" option selected (disabled by default), only deleting bars is possible.
Issues and Limitations
Under investigation
: When Market Manager support is enabled, the bars on some timeframes may be incorrectly filtered out.
Workaround
: disable AlphaVantage provider in the MM.
Forex data itself has issues currently: flatline weekend bars in the intraday data, weekend bars and crippled bars in the EOD data.
Price data itself lacks company name
Intraday data can have gaps due to splits and dividends that the provider doesn't account for since the split/dividend data is missing (doesn't apply to EOD)
Cryptocurrency data is not supported, and its support is not planned. Use
Cryptocurrency (Bitcoin) data provider
instead.
Check out the feed's website for usage quota/limitations on the free tier (e.g. 5 requests per minute) or premium plans.