Traders' Tip text
We’ve coded Ehler’s filter bank to measure the dominant cycle (DC) and the sine and cosine filter components in WealthScript for Wealth-Lab Version 6 (.NET). The CycleFilterDC function plots and returns the DC series and its components, so it’s a trivial matter to make use of them in a trading strategy.
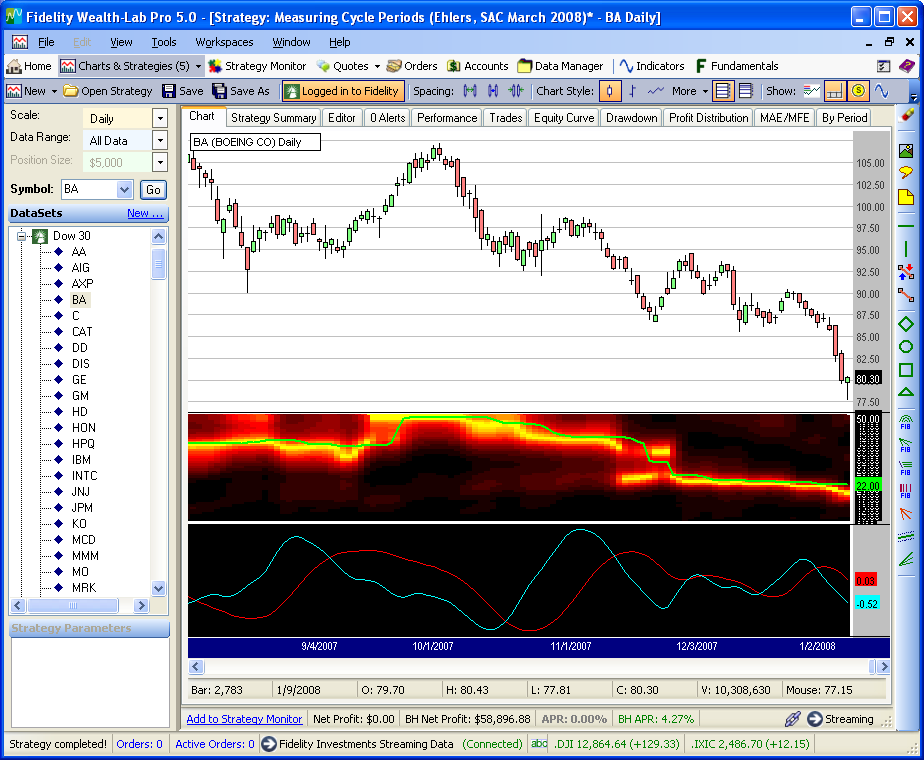 Figure 1.
 In this daily chart of cyclical price action, you can just about verify the dominant cycle measurement (plotted in lime on the heat map) by visual inspection.
Strategy Code
using System;
using System.Collections.Generic;
using System.Text;
using System.Drawing;
using WealthLab;
using WealthLab.Indicators;

namespace WealthLab.Strategies
{
	public class MyStrategy : WealthScript
	{
		public class ArrayHolder
		{	// current, old, older
			internal double I, I2, I3;
			internal double Q, Q2, Q3;
			internal double R, R2, R3;
			internal double Im, Im2, Im3;
			internal double A;
			internal double dB;
		}
		public DataSeries CycleFilterDC(DataSeries ds, out DataSeries sine, out DataSeries cosine)
		{
			double twoPi = 2 * Math.PI;

			// Initialize arrays
			ArrayHolder[] ah = new ArrayHolder[51];
			for( int n = 8; n < 51; n++ )
				ah[n] = new ArrayHolder();
			Color[] color = new Color[21];
			DataSeries[] DB = new DataSeries[51];

			double domCycle = 0d;
			string name = ds.Description;
			DataSeries result = Close - Close;
			result.Description = "Dominant Cycle(" + name + ")";

			// Create and plot the decibel series - change the colors later
			ChartPane dbPane = CreatePane(40, false, false );
			for( int n = 8; n < 51; n++ ) {
				DB[n] = result + n;
				DB[n].Description = "Cycle." + n.ToString();
				PlotSeries(dbPane, DB[n], Color.Black, LineStyle.Solid, 6);
			}
			// Convert decibels to RGB color for display
			for( int n = 0; n <= 10; n++ )		// yellow to red: 0 to 10 dB
				color[n] = Color.FromArgb(255, (int)(255 - (255 * n / 10)), 0);
			for( int n = 11; n <= 20; n++ )		// red to black: 11 to 20 db
				color[n] = Color.FromArgb( (int)(255 * (20 - n)/10 ), 0, 0);

			// Detrend data by High Pass Filtering with a 40 Period cutoff
			DataSeries HP = result;
			double alpha = (1 - Math.Sin(twoPi/40)) / Math.Cos(twoPi/40);
			for(int bar = 1; bar < Bars.Count; bar++)
				HP[bar] = 0.5 * (1 + alpha)* Momentum.Series(ds, 1)[bar] + alpha * HP[bar-1];
			DataSeries smoothHP = FIR.Series(HP, "1,2,3,3,2,1");

			for( int bar = 6; bar < Bars.Count; bar++ )
			{
				double maxAmpl = 0;
				double delta = -0.015 * bar + 0.5;
				delta = delta < 0.15 ? 0.15 : delta;
				for( int n = 8; n < 51; n++ )
				{
					double beta = Math.Cos(twoPi / n);
					double g = 1 / Math.Cos(2 * twoPi * delta / n);
					double a = g - Math.Sqrt(g * g - 1);
					ah[n].Q = Momentum.Series(smoothHP, 1)[bar] * n / twoPi;
					ah[n].I = smoothHP[bar];
					ah[n].R = 0.5 * (1 - a) * (ah[n].I - ah[n].I3) + beta * (1 + a) * ah[n].R2 - a * ah[n].R3;
					ah[n].Im = 0.5 * (1 - a) * (ah[n].Q - ah[n].Q3) + beta * (1 + a) * ah[n].Im2 - a * ah[n].Im3;
					ah[n].A = ah[n].R * ah[n].R + ah[n].Im * ah[n].Im;
					maxAmpl = ah[n].A > maxAmpl ? ah[n].A : maxAmpl;
				}
				double num = 0;	double den = 0;
				for( int n = 8; n < 51; n++ )
				{
					if( maxAmpl != 0 && ah[n].A / maxAmpl > 0 )
						ah[n].dB = 10 * Math.Log10( (1 - 0.99 * ah[n].A / maxAmpl) / 0.01 );
					ah[n].dB = ah[n].dB > 20 ? 20 : ah[n].dB;
					SetSeriesBarColor(bar, DB[n], color[(int)Math.Round(ah[n].dB)]);

					if( ah[n].dB <= 3 ) {
						num = num + n * (20 - ah[n].dB);
						den = den + (20 - ah[n].dB);
					}
					if( den > 0 ) domCycle = num/den;
					result[bar] = domCycle;

					ah[n].I3 = ah[n].I2;
					ah[n].I2 = ah[n].I;
					ah[n].Q3 = ah[n].Q2;
					ah[n].Q2 = ah[n].Q;
					ah[n].R3 = ah[n].R2;
					ah[n].R2 = ah[n].R;
					ah[n].Im3 = ah[n].Im2;
					ah[n].Im2 = ah[n].Im;
				}
			}
			result = Median.Series(result, 10);
			PlotSeries(dbPane, result, Color.Lime, WealthLab.LineStyle.Solid, 2);

			// sine and cosine components
			sine = Low - Low;  sine.Description = "sine(DC)";
			double a2 = 0d;
			for(int bar = 10; bar < Bars.Count; bar++)
			{
				double delta = -0.015 * bar + 0.5;
				delta = delta < 0.15 ? 0.15 : delta;
				double beta = Math.Cos(2 * Math.PI / result[bar] );
				double g = 1 / Math.Cos(4 * Math.PI * delta / result[bar]);
				if( g < 1 )
					a2 = 0;
				else
					a2 = g - Math.Sqrt(g * g - 1);
				sine[bar] = 0.5 * (1 - a2) * Momentum.Value(bar, smoothHP, 1)
						+ beta * (1 + a2) * sine[bar-1] - a2 * sine[bar-2];
			}
			cosine = ( result / 6.28 ) * ( sine - (sine >> 1) );
			cosine.Description = "cosine(DC)";

			ChartPane sinePane = CreatePane( 40, false, false );
			for(int bar = 0; bar < Bars.Count; bar++)
				SetPaneBackgroundColor(sinePane, bar, Color.Black);
			PlotSeries(sinePane, sine, Color.Red, LineStyle.Solid, 1);
			PlotSeries(sinePane, cosine, Color.Cyan, LineStyle.Solid, 1);
			return result;
		}

		protected override void Execute()
		{
			HideVolume();
			HidePaneLines();
			DataSeries avgPrice = (High + Low) / 2;
			avgPrice.Description = "Avg Price";

			// Get the dominant cycle, sine and cosine, and plot the heat map
			DataSeries sine, cosine;
			DataSeries DC = CycleFilterDC(avgPrice, out sine, out cosine);

			/* Use the DC, sine, and cosine DataSeries in a Trading Strategy here */
		}
	}
}