Trade Graphs | Rolling Performance Metrics
Modified on 2014/04/30 14:13 by Eugene — Categorized as: Visualizers
This view presents a chart of rolling
Win Rate
%,
Average Profit
% and
Profit Factor
on a single graph.
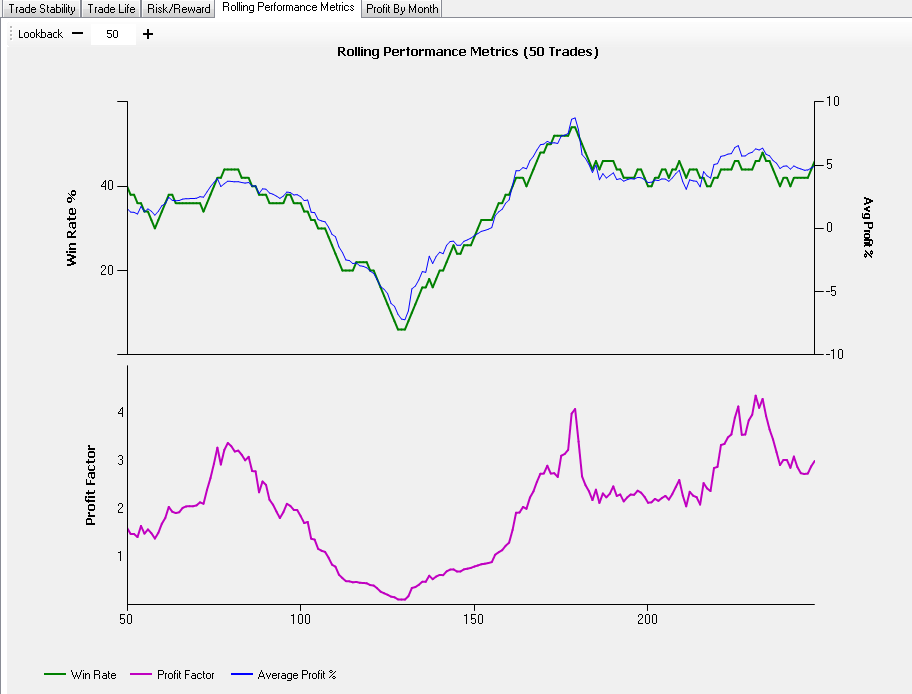
The upper chart shows the percent of Winning Trades (also called the Win/Loss Ratio) superimposed on a graph of the Average Profit percent in a rolling 30-trade window. The lower chart shows the dynamically evolving Profit Factor, or the absolute value of the gross profit of the strategy results in a lookback period divided by the gross loss in the same period). By default, the results are obtained using the 30-trade window.
We suggest that your Strategy produces at least 30 trades to be statistically valid. Although the criteria for statistical validity of a trading simulation varies, having at least 30 trades is a generally accepted baseline. Sophisticated souls can use different guidelines for a statistically valid estimate of system performance, such as at least 100 trades, or N times the number of optimizable parameters (where N is 10, 20 etc.) You can set a custom lookback period (i.e. number of trades) from the Lookback menu by typing in a number of using the +/- buttons.
For instance, if the win rate % has experienced a significant decline, it signals the trader that something fundamental about performance of the trading system could have changed, so possible reevaluation should be considered.
Double-clicking a Position number will bring the Wealth-Lab chart and center it on that trade. As with other performance visualizers, mousing over the lines will display a tooltip with the position number and an associated value (Win Rate or Profit Factor).
A view of Rolling Performance Metrics chart