This performance visualizer applies to Combination Strategies. Its purpose is to show a correlation matrix of Combination child strategies' equity curve.
It's known that a robust portfolio of systems should contain strategies that are negatively correlated to each, or at least are in a slightly positive correlation. You might want to use this visualizer to increase robustness and avoid locking capital in systems that essentially duplicate each other.
Correlation period is configurable (252 bars by default). Enter a desired period (no bigger than the data loading range) to recalculate the correlation matrix on-the-fly. Likewise, selecting correlation method (Excel correlation by default or Kendall Tau Rank) will rebuild the matrix.
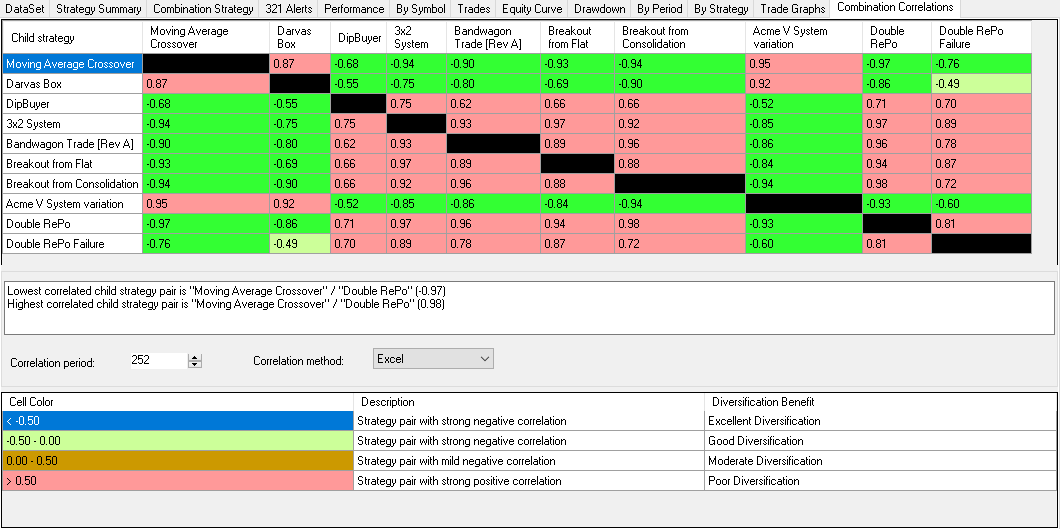 Combination Correlations |