This performance visualizer shows the performance distribution of a Strategy linked to the trade hold period. Each bin of the histogram corresponds to some trade hold period (e.g. 0-20 bars, 20-40 bars etc.) on the X-axis while the Y-axis represents the average % profit of trades that build up a bin.
For example, if the first bin represents three trades which were held from 0 to 20 bars, and which brought +4%, +2% and 10% net profit each, the Y-axis will show +5.3% as the average profit % of all trades that last up to 20 bars.
The bins with positive results are painted blue while the losing bins are red. The green line with labels the chart is superimposed with displays how many trades are contained in a bin. For example, it's typical for a no-frills trendfollowing system to have a profile like this - with many small losers cut quick and rather small number of highly profitable trades held for relatively long time that make the majority of profits:
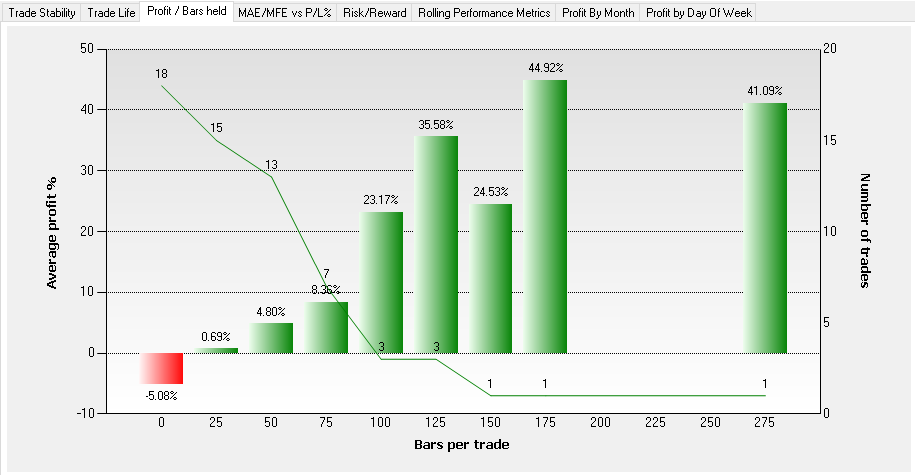 Profit / Bars Held |