Traders' Tip text
It's usually interesting to see if there's added benefit from including non-price information such as fundamental items or sentiment data into a system's rules. In addition to having an intermarket filter (Beta), the system featured in this month's article by Donald W. Pendergast Jr. puts emphasis onto beating a stock's most recent quarterly earnings estimates as one of the key elements. To be able to backtest its rules and generate signals for live trading, Wealth-Lab customers should use one of the fundamental data sources that provides access to earnings surprises data – for example,
99WallStreet.com StreetInsider.com Zacks for which a
fundamental provider already exists.
The strategy we're using to illustrate the trading method adheres to the bullet point list of entry criteria with one exception: it's not required for a stock to have a strong history of positive earnings surprises over the last couple of years as that would limit the number of signals to a mere handful. To enter, the system would scout for stocks where the five technical, intermarket and fundamental conditions are in place, and then wait while a stock's 2-day RSI crosses above 5 from the oversold territory. As we found the proposed exit strategy triggering too many false signals, not allowing to uncover the system's potential, we replaced it with a simple trailing exit at a 20-day stop of the daily lows.
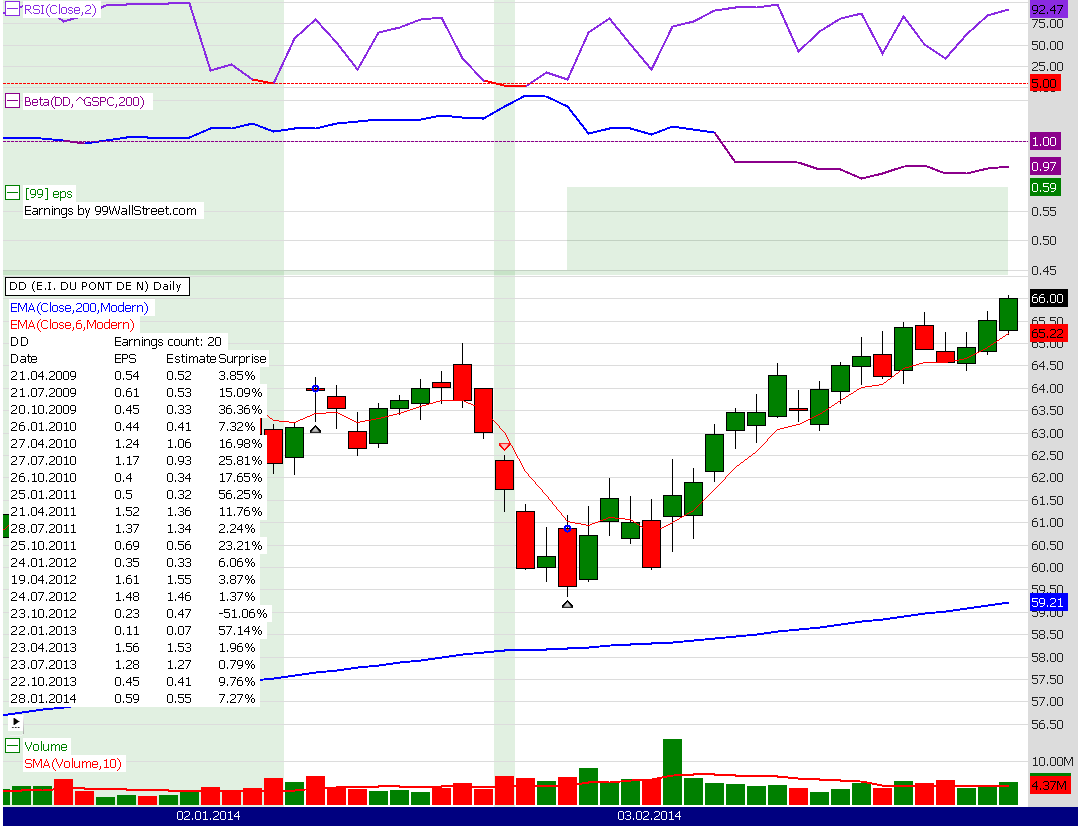 |
Figure 1. A Wealth-Lab 6 chart showing the application of the fundamental & technical rules from Mr.Pendergast's article on the Daily chart of DD (Dupont). The upper pane shows the 2-day RSI, below is the 200-day Beta indicator, on top of price there are historical quarterly earnings releases, and volume with average 10-day volume are at the bottom.There are two prerequisites to successfully execute the included Strategy in Wealth-Lab:
- Install Community Indicators library to build the Beta indicator
- Install
Install 99WallStreet fundamental data provider StreetInsider fundamental data provider Zacks Adjusted Earnings (EPS) provider AND download the earnings surprise data for your DataSet
Latest versions of both libraries are available to registered customers for download from the Extensions section of our website (restart Wealth-Lab after installation or update).
using System;
using System.Collections.Generic;
using System.Text;
using System.Drawing;
using WealthLab;
using WealthLab.Indicators;
using Community.Indicators;

namespace WealthLab.Strategies
{
	public class TASC201405Pendergast : WealthScript
	{
		protected override void Execute()
		{
			const char tab = '\u0009';
			string item = "[z] Zacks Adjusted Earnings";
			IList<FundamentalItem> fList = FundamentalDataItems(item);
			DataSeries e = FundamentalDataSeries(item);
			ChartPane ep = CreatePane( 20, true, true );
			PlotFundamentalItems(ep, item, Color.Green, WealthLab.LineStyle.Invisible, 1);
			DrawLabel(ep, "Earnings by Zacks");

			if( fList.Count == 0 )
			{
				DrawLabel( PricePane, "Update Zacks Adjusted Earnings data before running the Strategy");
				Abort();
			}

			DrawLabel(PricePane, Bars.Symbol + tab + tab + "Earnings count: " + fList.Count);
			DrawLabel(PricePane, "Date" + tab + tab + "EPS" + tab + "Estimate" + tab + "Surprise");
			foreach (FundamentalItem fi in fList)
			{
				DrawLabel(PricePane,
					fi.Date.ToShortDateString() + tab +
					fi.Value.ToString() + tab +
					fi.GetDetail("estimate") + tab +
					fi.GetDetail("surprise"));
			}

			Bars spx = GetExternalSymbol("^GSPC", true); // Yahoo data
			Beta beta = Beta.Series( Bars, spx,200);
			ChartPane pb = CreatePane( 20, true, true );
			PlotSeries( pb, beta, Color.DarkMagenta, LineStyle.Solid, 2 );
			DrawHorzLine( pb, 1.0, Color.DarkMagenta, LineStyle.Dashed, 1 );

			DataSeries smaAvgVol = SMA.Series(Volume, 10);
			PlotSeries( VolumePane, smaAvgVol, Color.Red, LineStyle.Solid, 2 );

			DataSeries ema = EMA.Series(Close,200,EMACalculation.Modern);
			DataSeries ema6 = EMA.Series( Close,6,EMACalculation.Modern);
			PlotSeries( PricePane, ema, Color.Blue, LineStyle.Solid, 2 );
			PlotSeries( PricePane, ema6, Color.Red, LineStyle.Solid, 1 );

			DataSeries rsi = RSI.Series(Close,2);
			ChartPane pr = CreatePane( 20, true, true );
			PlotSeries( pr, rsi, Color.BlueViolet, LineStyle.Solid, 2 );
			DrawHorzLine( pr, 5, Color.Red, LineStyle.Dashed, 1 );
			for(int bar = 2; bar < Bars.Count; bar++)
			{
				if ( rsi[bar] < 5 )
					SetSeriesBarColor( bar, rsi, Color.Red );
				if ( beta[bar] > 1 )
					SetSeriesBarColor( bar, beta, Color.Blue );
			}

			bool SetupValid = false;

			for(int bar = GetTradingLoopStartBar(200); bar < Bars.Count; bar++)
			{
				if (IsLastPositionActive)
				{
					SellAtTrailingStop( bar+1, LastPosition, Lowest.Series( Low, 20 )[bar], "Trailing Stop" );
				}
				else
				{
					if( !SetupValid )
					{
						bool rsi2 = rsi[bar] < 5;
						bool ema200 = Close[bar] > ema[bar];
						bool avgVol = smaAvgVol[bar] >= 1000000;
						bool surprise = false;

						for(int i = fList.Count-1; i >= 0; i--)
						{
							if( bar > fList[i].Bar )
							{
								surprise = ( Double.Parse( fList[i].GetDetail("surprise").Replace("+","").Replace("$","") ) > 0 );
								break;
							}
						}

						bool bet = beta[bar] > 1.0;

						if( surprise )
							SetBackgroundColor( bar, Color.FromArgb(30,Color.Green) );

						if( rsi2 && ema200 && avgVol && surprise && bet )
							SetupValid = true;
					}

					if( SetupValid )
					{
						if( CrossOver( bar, rsi, 5 ) )
							if( BuyAtMarket(bar+1) != null )
								SetupValid = false;
					}
				}
			}
		}
	}
}
Eugene
Wealth-Lab team
www.wealth-lab.com