Traders' Tip text
We combined the ideas and indicators from the article into a single script with a sample strategy in C# for Wealth-Lab 6. While you can probably think of a dozen ways to use the cycle mode indicator and its thresholds, the sample strategy enters long trades when the cycle turns up within the threshold zone and exits on a closing profit of 4% or after 5 bars. The time-based exit was chosen purposely to be a ¼ cycle to exit before the next turn down. The Strategy produced a slightly-positive win rate and raw profit factor for the last 6 years of trading on the Dow 30 and Nasdaq 100 index components.
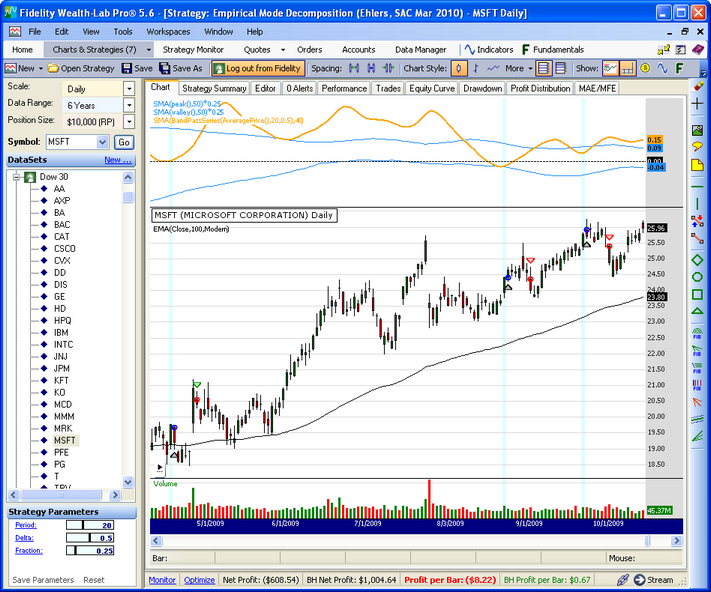 Figure 1.
 Representative trades from the sample Strategy.
WealthScript Code (C#)
using System;
using System.Collections.Generic;
using System.Text;
using System.Drawing;
using WealthLab;
using WealthLab.Indicators;

namespace WealthLab.Strategies
{
   public class EmpiricalModeDecomp : WealthScript
   {
      StrategyParameter _period;
      StrategyParameter _delta;
      StrategyParameter _fraction;

      public EmpiricalModeDecomp()
      {
         _period = CreateParameter("Period", 20, 5, 50, 1);
         _delta = CreateParameter("Delta", 0.5, 0.05, 1, 0.05);
         _fraction = CreateParameter("Fraction", 0.25, 0.1, 1, 0.05);
      }

      public DataSeries BandPassSeries(DataSeries ds, int period, double delta)
      {
         DataSeries res = new DataSeries(ds, "BandPassSeries(" + ds.Description + "," + period + "," + delta + ")");
         double beta = Math.Cos(2 * Math.PI / period);
         double gamma = 1/ Math.Cos(4 * Math.PI * delta / period);
         double alpha = gamma - Math.Sqrt(gamma * gamma - 1d);

         for (int bar = 2; bar < ds.Count; bar++)
         {
            res[bar] = 0.5 * (1 - alpha) * (ds[bar] - ds[bar - 2])
               + beta * (1 + alpha) * res[bar - 1] - alpha * res[bar - 2];
         }
         return res;
      }

      protected override void Execute()
      {
         int per = _period.ValueInt;
         double delta = _delta.Value;
         double fraction = _fraction.Value;

         DataSeries bp = BandPassSeries(AveragePrice.Series(Bars), per, delta);
         DataSeries ema = EMA.Series(Close, 100, EMACalculation.Modern);
         DataSeries mean = SMA.Series(bp, 2 * per);
         mean.Description = "SMA(" + bp.Description + "," + 2 * per + ")";
         DataSeries peak = new DataSeries(Bars, "peak()");
         DataSeries valley = new DataSeries(Bars, "valley()");
         double pk = 0d;
         double v = 0d;
         for(int bar = 2; bar < Bars.Count; bar++)
         {
            if( bp[bar-1] > bp[bar] && bp[bar-1] > bp[bar-2] )
               pk = bp[bar - 1];
            if( bp[bar-1] < bp[bar] && bp[bar-1] < bp[bar-2] )
               v = bp[bar-1];
            peak[bar] = pk;
            valley[bar] = v;
         }
         int avgPer = (int)(2.5 * per);
         DataSeries avgPeak = fraction * SMA.Series(peak, avgPer);
         DataSeries avgValley = fraction * SMA.Series(valley, avgPer);

         ChartPane cp = CreatePane( 40, true, false );
         DrawHorzLine(cp, 0d, Color.Black, LineStyle.Dashed, 1);
         PlotSeries(PricePane, ema, Color.Black, LineStyle.Solid, 1);
         PlotSeries(cp, avgPeak, Color.DodgerBlue, LineStyle.Solid, 1);
         PlotSeries(cp, avgValley, Color.DodgerBlue, LineStyle.Solid, 1);
         PlotSeries(cp, mean, Color.Orange, LineStyle.Solid, 2);

         /* Sample Trading Strategy */
         for (int bar = 2 * 100; bar < Bars.Count; bar++)
         {
            bool setup = mean[bar] > avgValley[bar]
               && mean[bar] < avgPeak[bar]
               && ema[bar] > ema[bar-1];

            if (IsLastPositionActive)
            {
               Position p = LastPosition;
               if (bar - p.EntryBar > 4)
                  SellAtMarket(bar + 1, p, "Time Based");
               else if (Close[bar] > p.EntryPrice * 1.04)
                  SellAtClose(bar, p, "Profit Target");
            }
            else if ( setup && TurnUp(bar, mean) )
            {
               SetBackgroundColor(bar, Color.LightCyan);
               BuyAtMarket(bar + 1);
            }
         }
      }
   }
}