The Heikin Ashi ChartStyle is a chart style which is similar to the usual OHLC bar style except that it implements the Heikin-Ashi chart. Instead of using the traditional OHLC bars, the Heikin-Ashi technique uses a modified formula:
Close = (Open+High+Low+Close)/4
Open = [Open (previous bar) + Close (previous bar)]/2
High = Max (High,Open,Close)
Low = Min (Low,Open,Close)
The most prominent benefit of the Heikin-Ashi technique is identifying a trend more visibly. Heikin Ashi eliminates irregularities from a chart, offering a smoother picture of trends and consolidations, allowing to get a better idea of the market's strength and direction. In addition, there are no gaps on a Heikin Ashi chart because the OHLC is modified.
Interpretation
- White candles display a rising trend, while black candles indicate a downtrend.
- Strong positive trends have long white bodies with no lower shadows, while strong negative trends have long black bodies with no upper shadows.
- When bodies become shorter, a weaker trend is anticipated
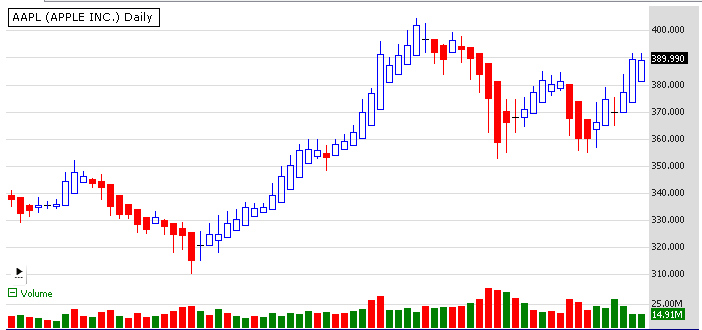 A Heikin Ashi chart vs. standard OHLC bar chart |