Trade Graphs | Profit By Day of Week
Modified on 2015/05/31 12:12 by Eugene — Categorized as: Visualizers
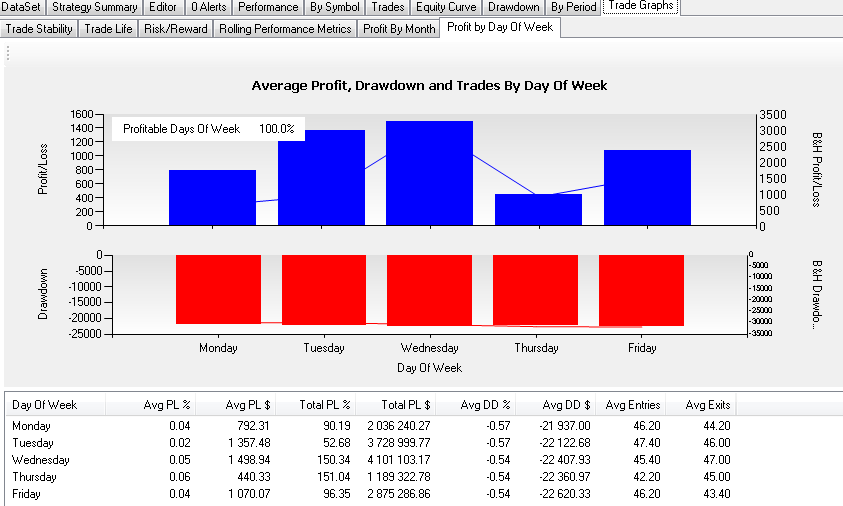
This tab presents a side by side view of
Profit
and
Drawdown
by day of week.
The upper chart shows the average Profit/Loss (on a dollar basis) of any day of week. The system's numbers are represented as histogram bars, superimposed by Buy&Hold's average returns on the matching days. Additionally, the number of profitable days of week is shown.
The lower chart shows the average Drawdown (on a dollar basis) in any day of week. The system's numbers are represented as histogram bars, superimposed by Buy&Hold's average drawdown.
Note:
as B&H is plotted on a secondary Y axis, its values are not directly comparable to the system's P/L.
In the table below, you can find some extended statistics in addition to all these numbers: average P/L on dollar and percentage basis, total P/L on dollar and percentage basis, average drawdown on dollar and percentage basis, and the number of average entries and exits on a given day of week.
Profit By Day of Week chart