Features
MEGAN RatioThe MEGAN ratio was presented by Oscar G. Cagigas in January, 2009 issue of Technical Analysis of Stocks & Commodities. See
this article for more information.
Closed trade drawdownDisplays maximum drawdown based on closed trade equity, i.e. excluding unrealized trades.
- Max closed trade drawdown ($) + Max closed trade drawdown ($) date
- Max closed trade drawdown (%) + Max closed trade drawdown (%) date
Note: Does
not apply to Buy&Hold. Reason is obvious: Buy&Hold does not have closed trades. Ignore zero values in the Buy&Hold column.
Trade statisticsProvides various trade statistics:
- T-Test
- Total shares traded
- Average one-way Commission
- Profit Per Bar (also in Portfolio Simulation mode)
- Performance ratio, Luck Coefficient
- Pessimistic Rate of Return - a statistical adjustment of the wins to losses ratio for the purpose of estimating the worst-expected return from previous results. It is calculated as follows:
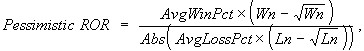 Wn = Number of Wins, Ln = Number of Losers,
AvgWinPct = Average Win %, AvgLossPct = Average Loss% |
E-Ratio - Popularized by Curtis Faith, e-ratio is the sum of Maximum Favorable Excursion % of all trades divided by the sum of Maximum Adverse Excursion % of all trades. The higher the ratio, the more trades move in your favor and the higher the entry point's potential.
Trade EfficiencyAverage entry (or exit) efficiency is defined as the sum of all maximum possible realized difference in prices from all trades that has the trade entry (or exit) price expressed as a part of the total profit potential divided by the number of trades. Average entry (or exit) efficiency shows how well a system enters into a trade (or exits from a trade.) Average total efficiency is the sum of realized differences in prices from all trades expressed as a part of the total profit potential divided by the number of trades. It shows how well the total moves of the trades has been used.
For more information, refer to the downloadable article by Leo Zamansky, Ph.D., and David C. Stendahl in Stocks & Commodities V15:10 (461-464):
Evaluating System Efficiency.
To avoid outliers in efficiency analysis, a companion performance metric can be used to determine whether the standard deviation of efficiency is high compared with the average efficiency:
Coefficient of Variation = Standard Deviation / Average (in %)
If it is, the system should benefit from a better entry/exit timing and the smaller it is, the more consistent is trading efficiency of the system.
- Shows average Entry, Exit and Total trade efficiency as well as Coefficient of Variation.
Outlier tradesOutlier analysis is an important topic of its own and therefore should not be overlooked. An outlier trade exceeds the average trade by +/- 3 Standard Deviations, and can skew the results. The following performance metrics are reported here:
- Total, positive and negative outliers
- Profit of outlier trades
- Select Net Profit - profit after removing the results of all outlier trades.
- Select Net Profit % (calculated as Select Net Profit / Starting Capital)
Second block of outlier results feature same metrics but percentage-adjusted i.e. using standard deviation of trade percentages. Outliers based on standard deviation of profit percent present a more adequate calculation on longer backtest ranges. For more information refer to this forum thread:
Performance+ Outlier Trades Discussion and RequestRisk/rewardThese metrics help evaluate performance from the risk/reward standpoint:
- Seykota Lake Ratio
- APD Ratio, APAD Ratio (by Beau Wolinsky)
- MAR Ratio
- K-Ratio
- Ulcer Index: in Wikipedia, article at Online Trading Concepts
- Ulcer Performance Index
- Sortino ratio: see Investopedia
- Tail ratio: Ratio between the 95th and (absolute) 5th percentile of the daily returns distribution. For example, a tail ratio of 0.25 means that losses are four times as bad as profits. More info
- Median Profit: midpoint in the frequency distribution of the trades (gain), i.e., the 50th percentile. Unlike the average profit, the normal median avoids the effect of outlier trades.
Risk/reward ratioAll risk/reward metrics, with "Expectancy (traditional)" being the exception, require your system to have a
RiskStopLevel defined:
- Average risk/reward ratio
- Risk/reward ratio standard deviation
- Average risk/reward ratio (winning trades)
- Average risk/reward ratio (losing trades)
- Maximum risk/reward ratio
- Minimum risk/reward ratio
- Expectancy
- Expectancy (traditional)
Risk of ruinModified risk of ruin formula by Ralph Vince from Perry Kaufman's book "New Trading Systems and Methods" (4th ed. 2005).
Risk of Ruin = ((1 - P)/P)^(MaxRisk/A),
where:
A is the square root of the sum of the squares of possible events, (ProbWin*AvgWin%^ 2 + ProbLoss*AvgLoss%^2) ^ (1/2)
New highs/lows- Percentage of bars on which a new equity high is made
- Longest drawdown duration
- Average drawdown